Ethan Miller · Analytics & engineering · Schenectady, NY

Data systems, end to end.

My titles have said business analyst, software engineer, and director of analytics, but the job’s always been the same: someone has a problem, and I build whatever solves it. Sometimes that’s the warehouse underneath, sometimes the model that makes the data mean something, sometimes the application it all gets delivered in. Usually it’s all three, carried the whole way from raw data to a working product someone actually uses.

The projects below are independent work, built on public data and running on hardware I manage myself. Each one started as a real question and ended as a running application.

9
years in analytics and software
2
NFL clubs
75,327
games ingested
2.38M
shots mapped

Selected work — independent, public data

Real-time basketball coaching platform

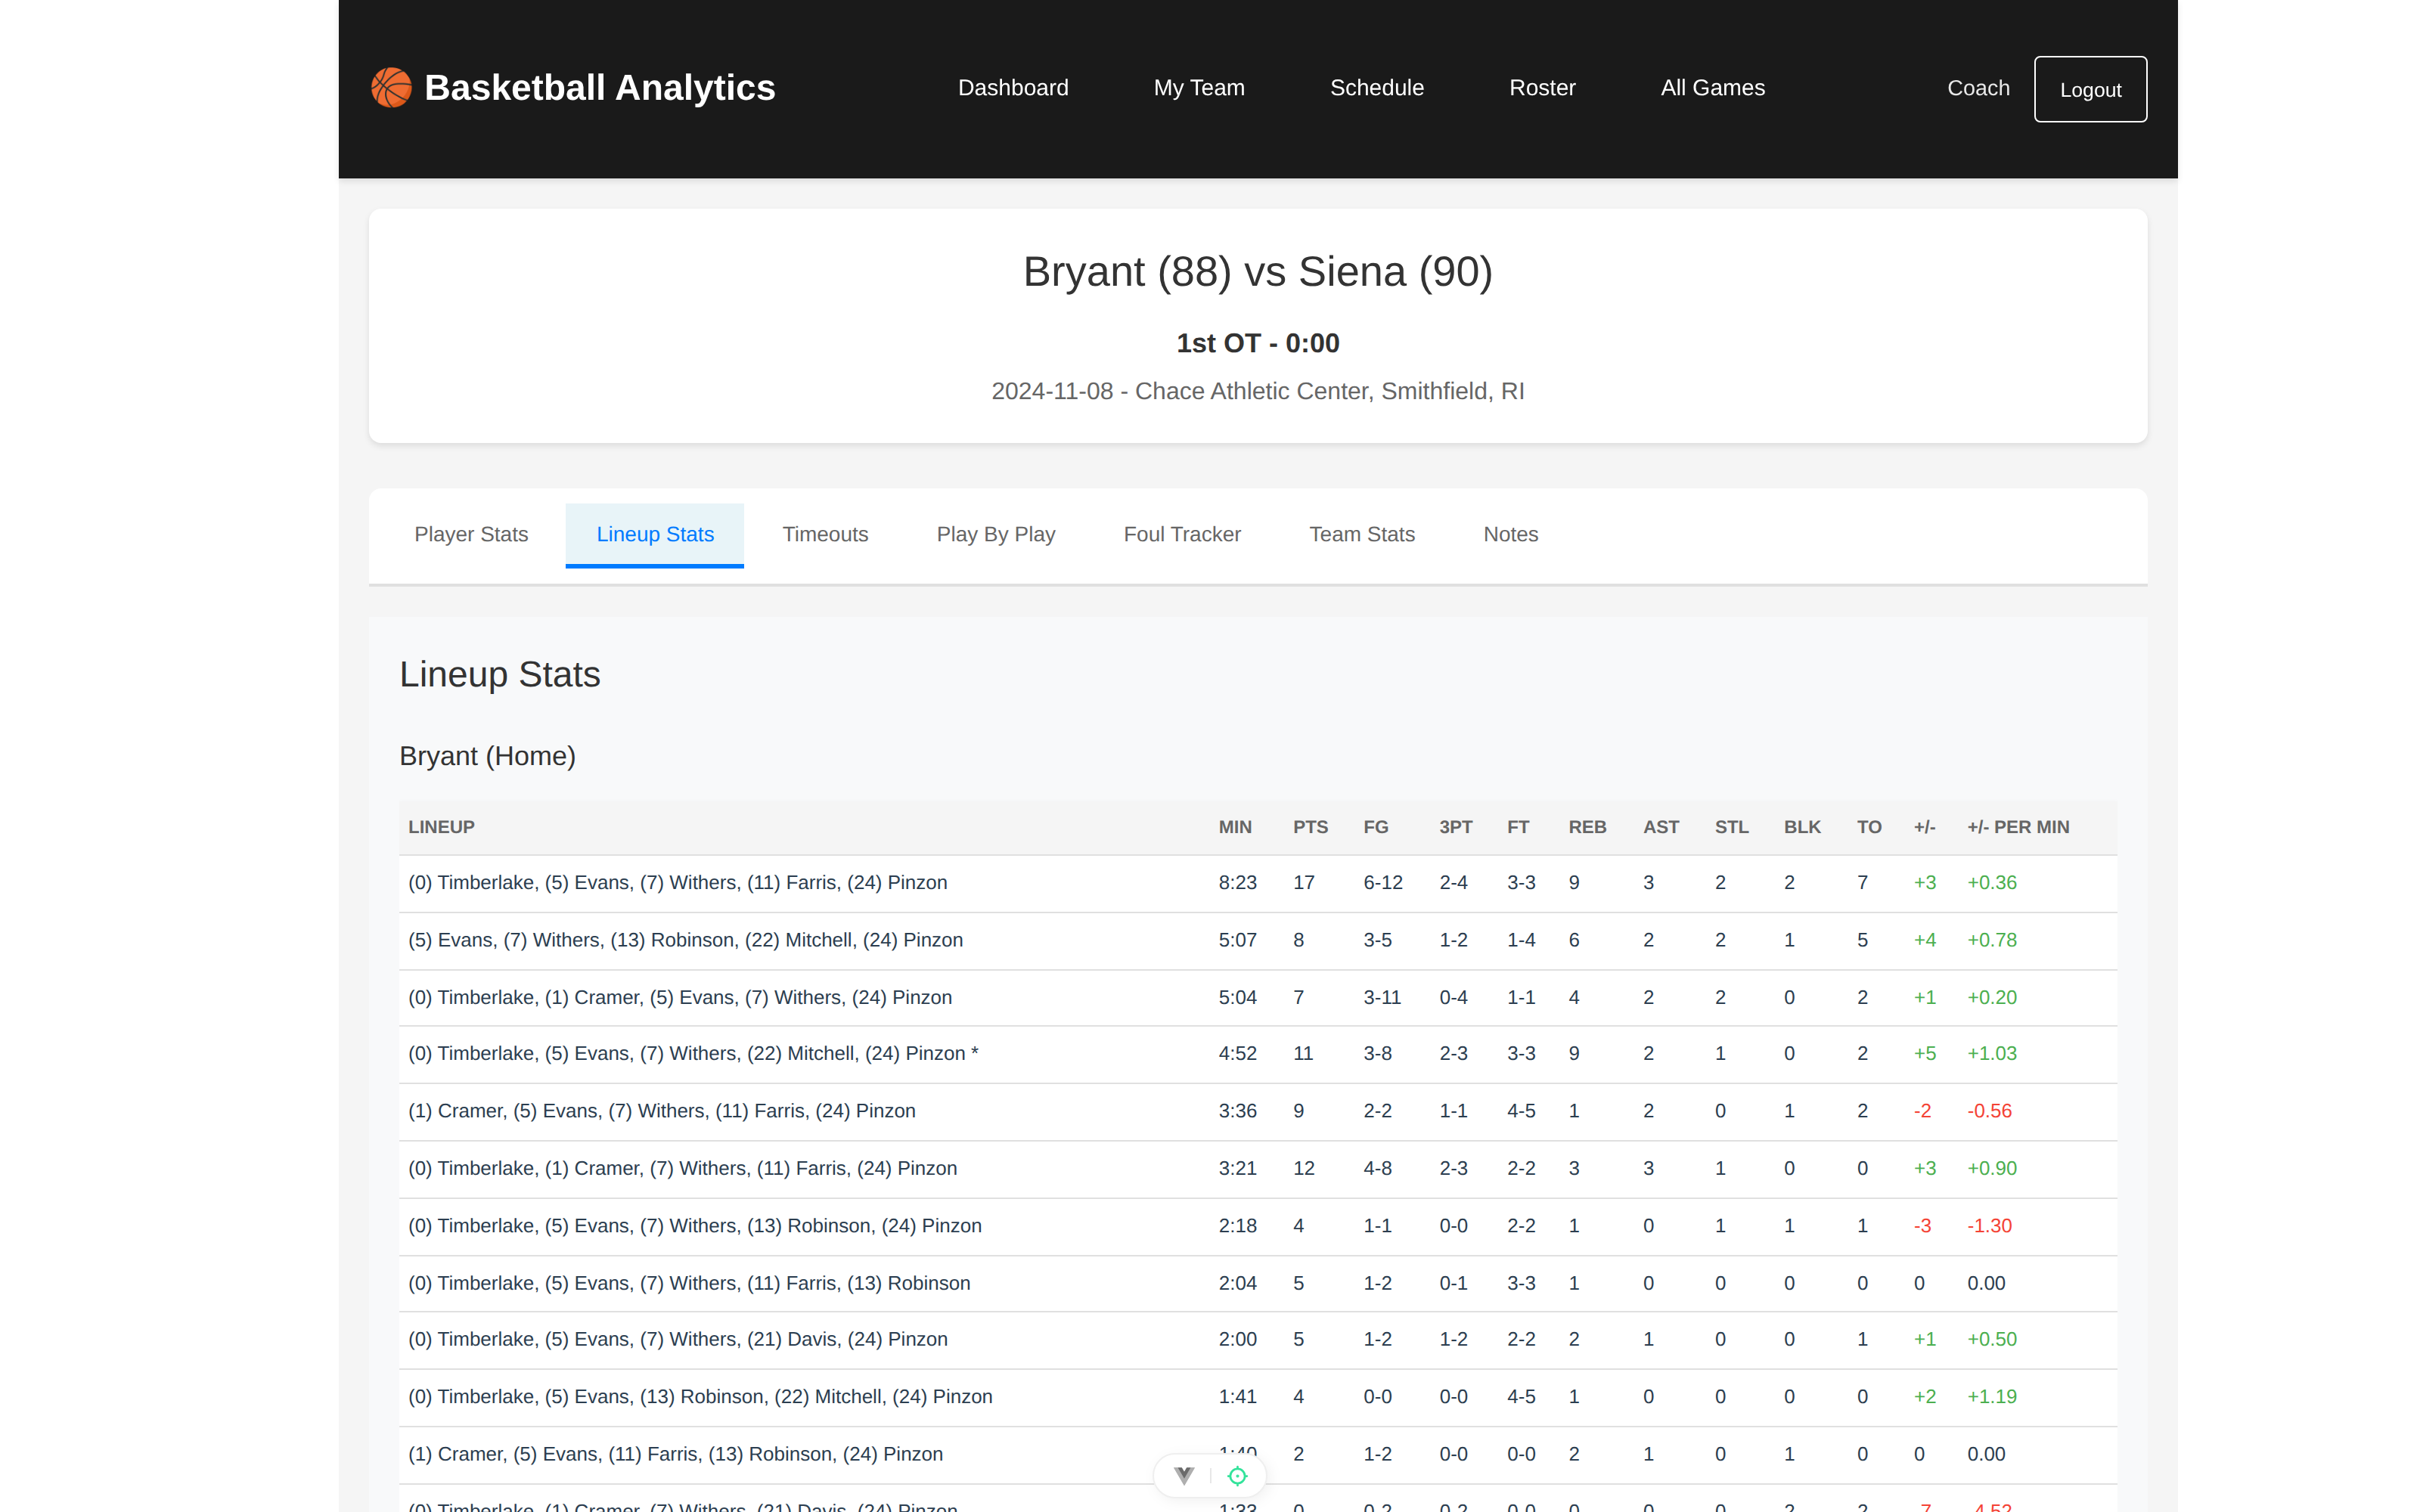
An in-game analytics platform for college basketball coaching staffs. It parses the live play-by-play feed into possessions, lineups, and running plus/minus while the game runs, and coaches log structured notes against the action as it happens. It works on the two stat feeds that between them carry nearly all of Division I and II.
Python Django Vue.js PostgreSQL Redis WebSockets Case study →
The platform's lineup stats view for Bryant at Siena: five-man lineup combinations with minutes, shooting splits, plus/minus, and plus/minus per minute.

A full conference season, stats and video unified

Every 2025-26 ACC men's basketball game in one system: play-by-play scraped and validated, lineup and possession analytics, shot charts, win probability, and full-game broadcast video keyed to the game clock.

Python Django Vue.js PostgreSQL FFmpeg Case study →
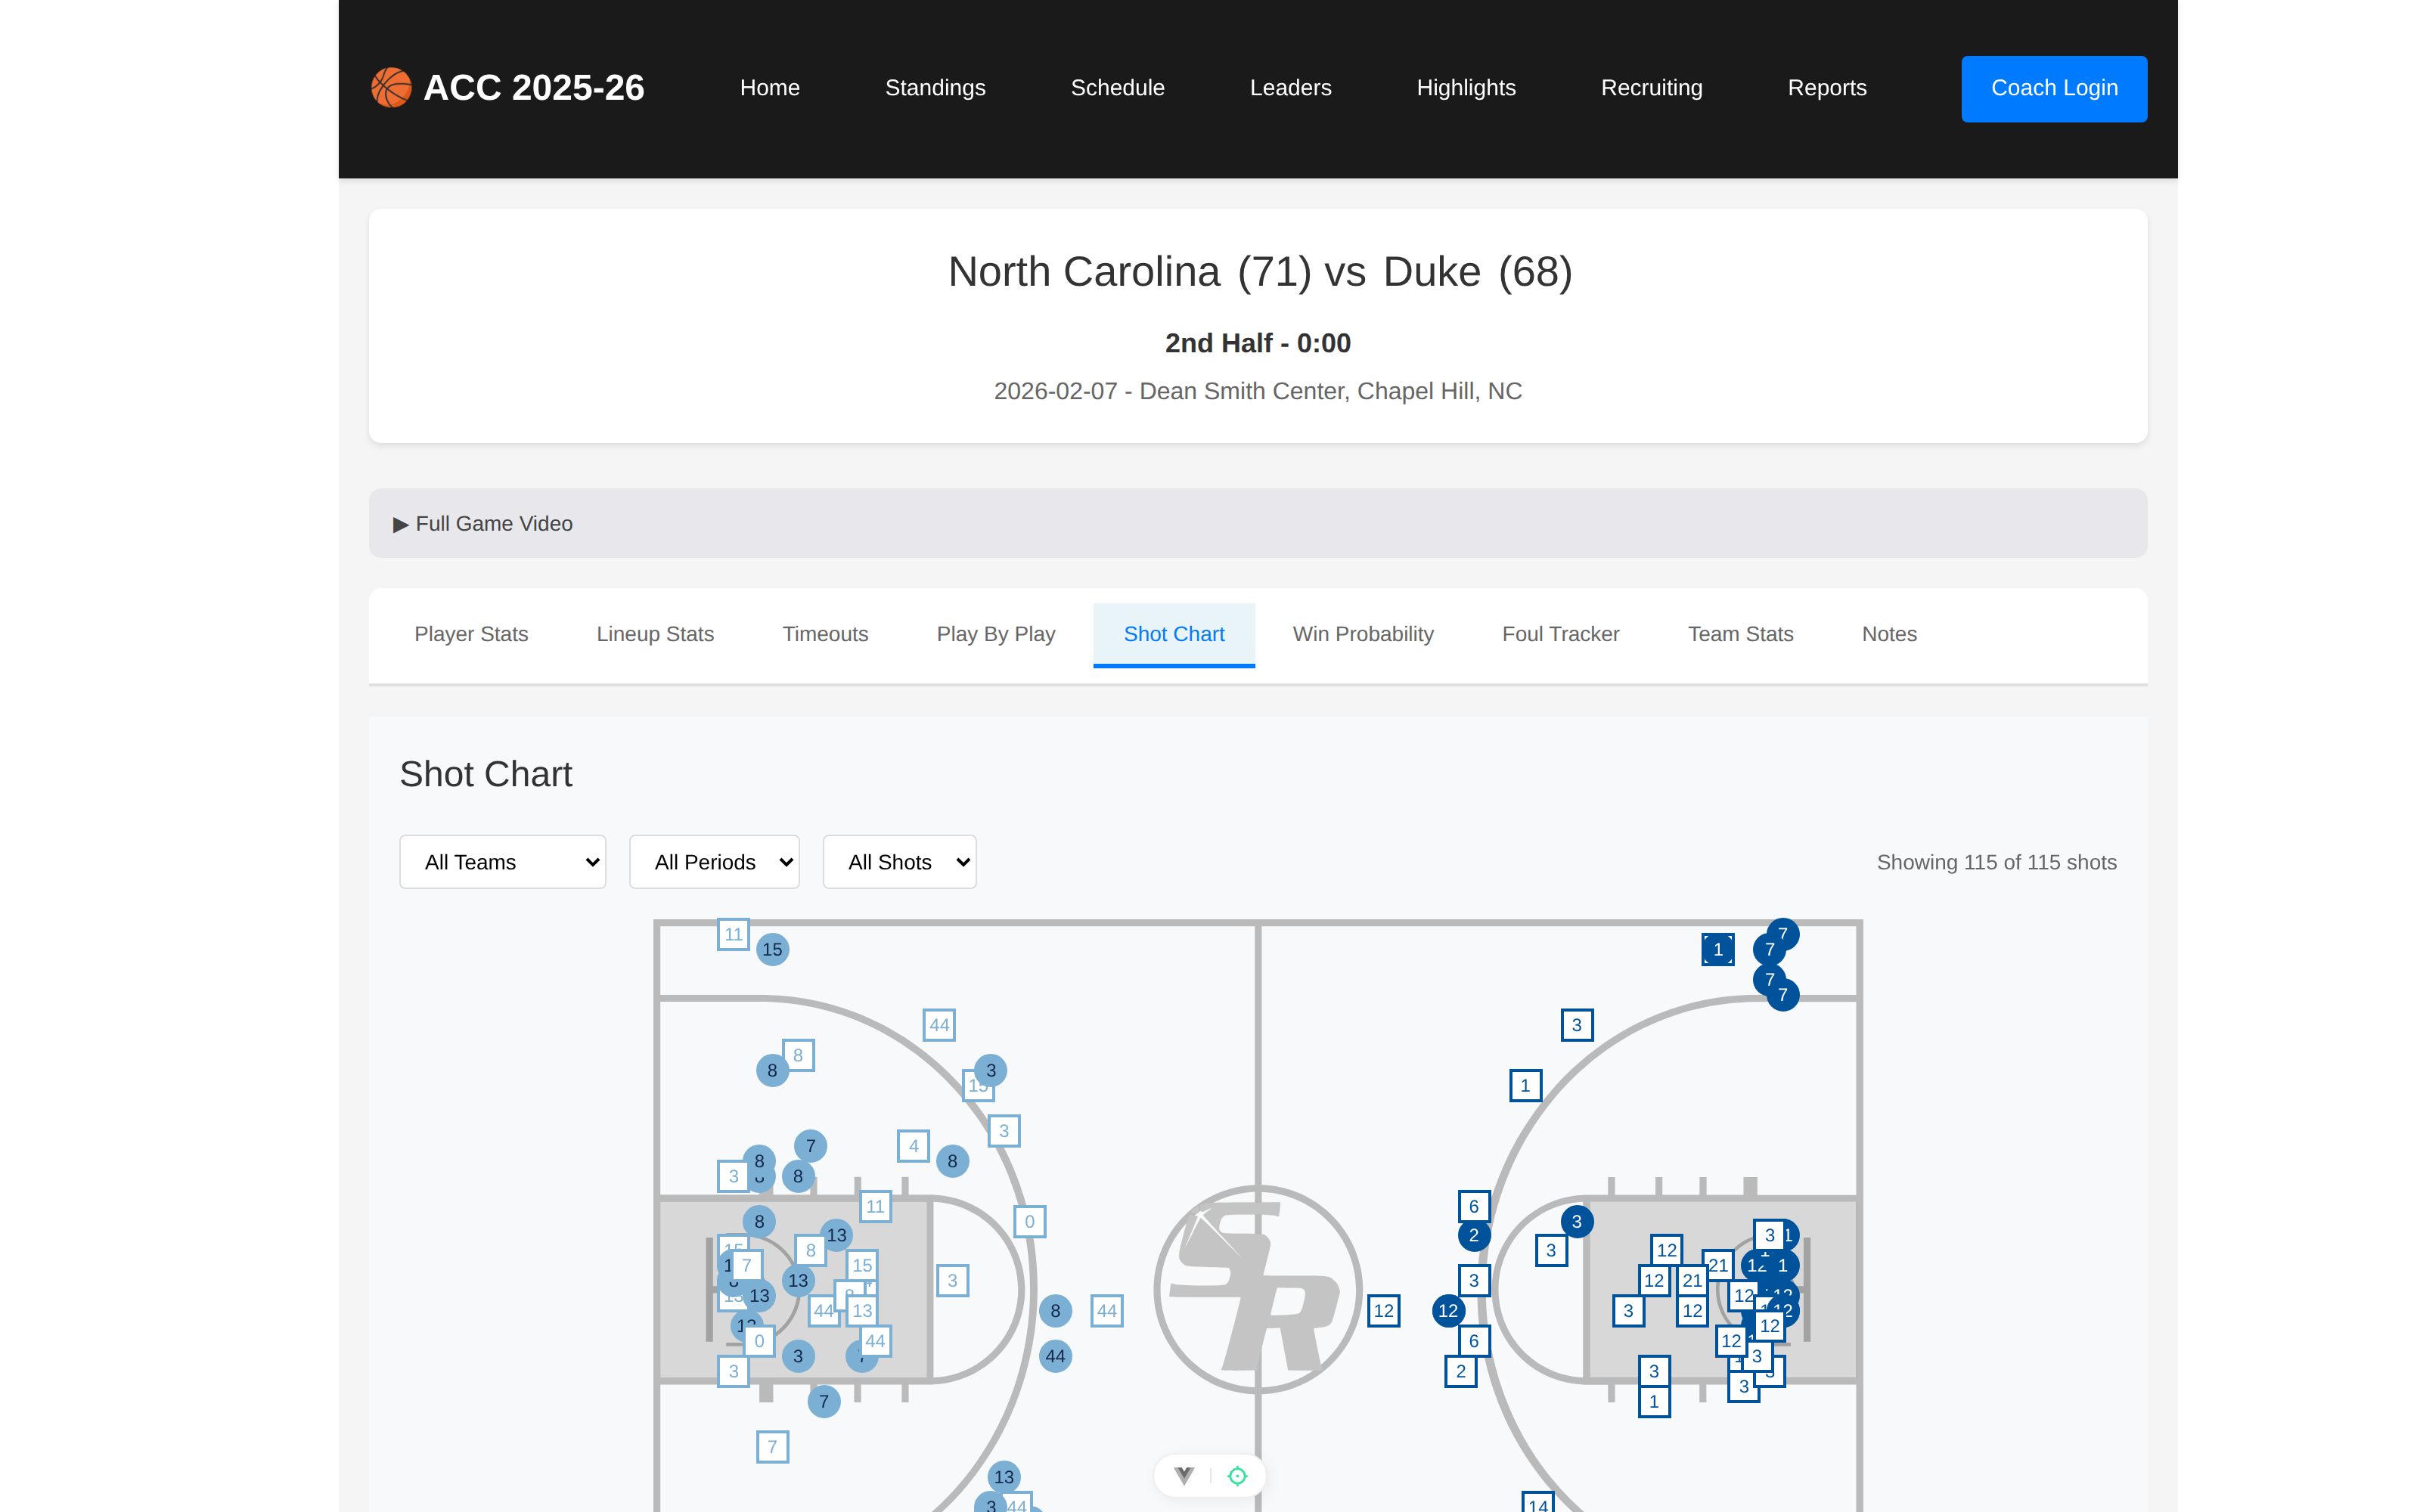
The shot chart for North Carolina 71, Duke 68 on February 7, 2026: all 115 shots plotted on a court diagram, filterable by team, period, and shot type.

Building the D2 basketball dataset that didn't exist

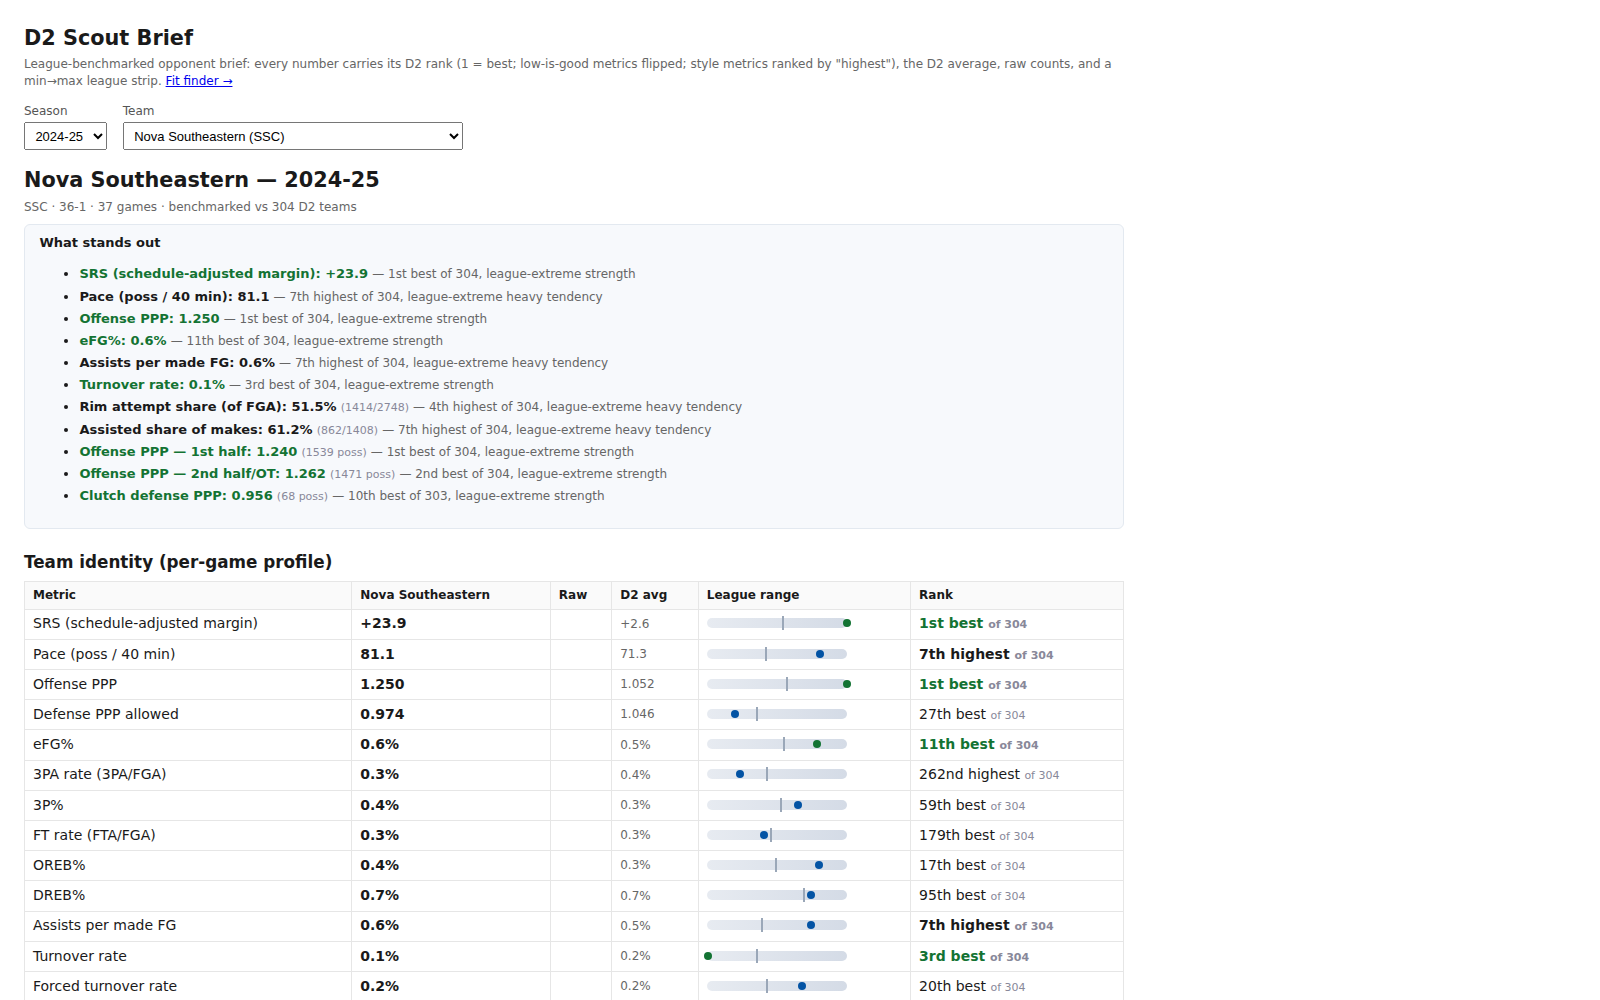
Nine seasons of college basketball in one warehouse: 72,593 games, 31 million plays, every Division II program's roster, staff, and player profiles. Built to answer a transfer portal question that no public dataset could.

Python Django PostgreSQL Playwright scikit-learn Case study →
The D2 scout brief for Nova Southeastern's 2024-25 season, with every metric ranked against 304 Division II teams.

A season of NWSL data, stood up in one morning

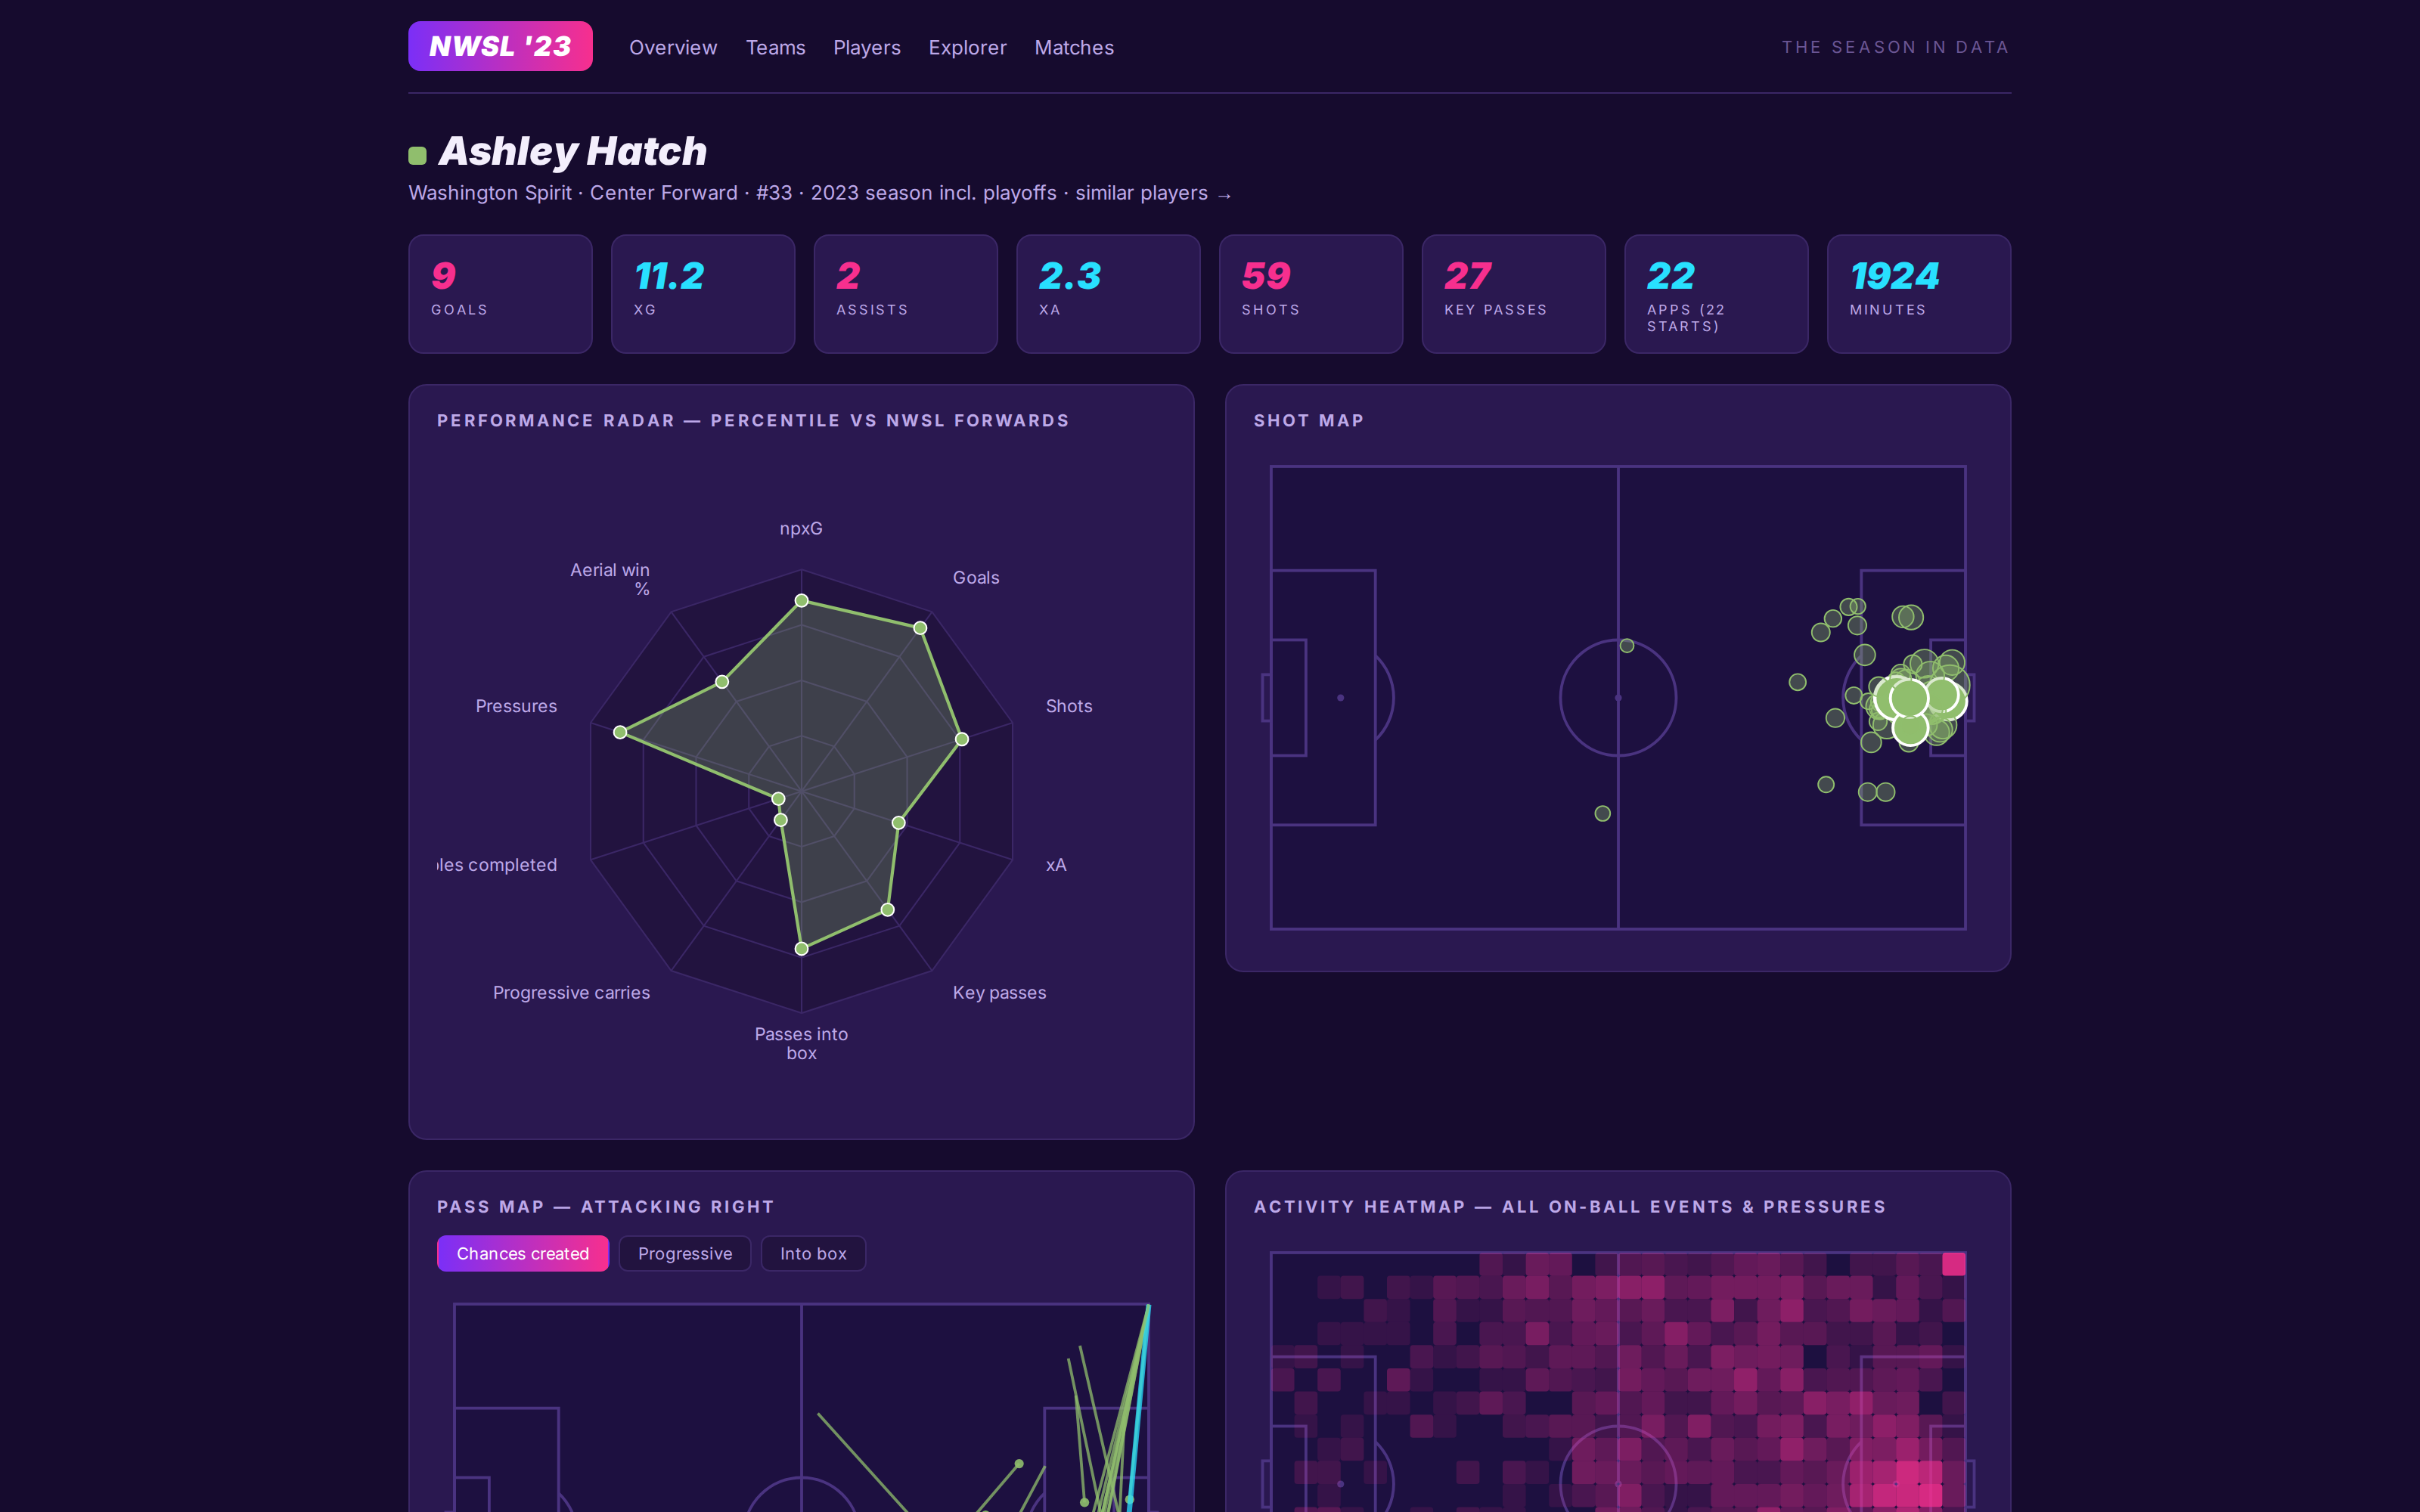
A LinkedIn post shared free StatsBomb event data for the 2023 NWSL season. By breakfast a Postgres warehouse, an API, and a dashboard were running; by the end of the day the database held thirteen women's competition-seasons.

Python Django PostgreSQL SQL Claude Code Case study →
The player page for Ashley Hatch: season totals, a percentile radar against NWSL forwards, a shot map, a pass map, and an activity heatmap.

NFL warehouse and front-office tools

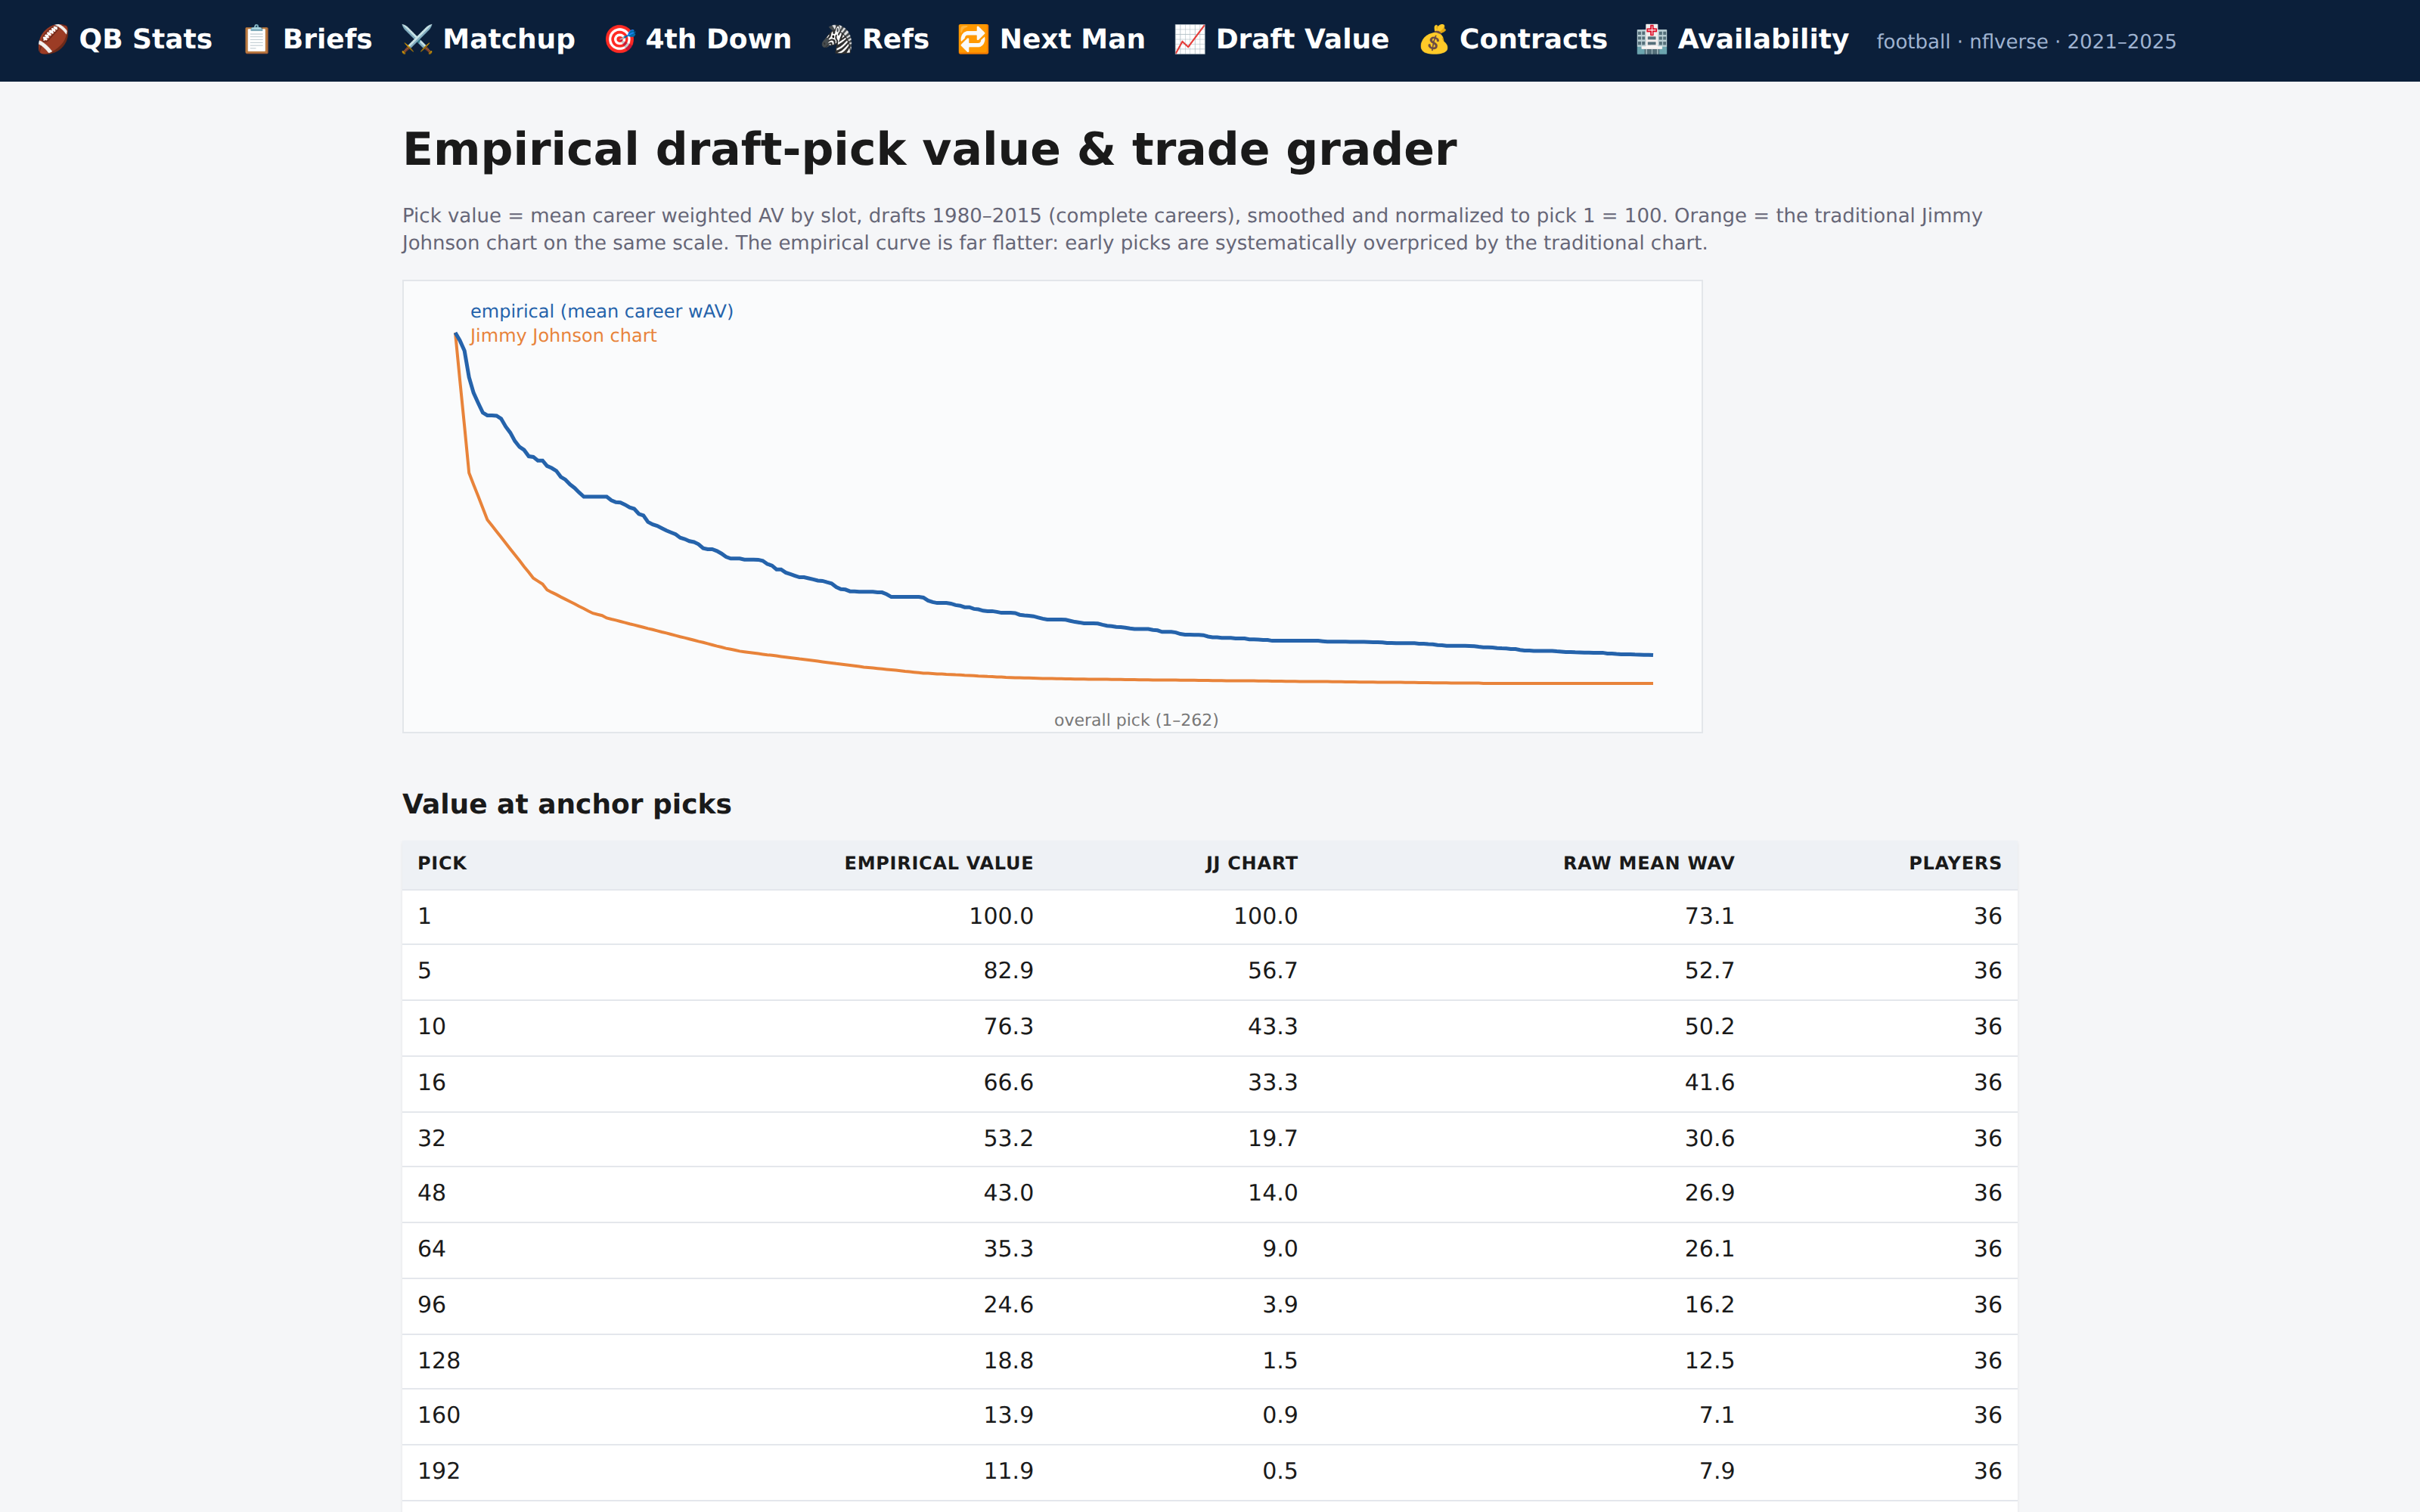
A Postgres warehouse over five seasons of public NFL data, and a Django application that turns it into decision tools: an empirical draft-pick value chart, a player availability model, and a fourth-down decision grader.

Python PostgreSQL Django SQL scikit-learn Case study →
The draft-pick value tool: an empirical pick-value curve plotted against the Jimmy Johnson chart, with a table of values at anchor picks.

Experience

Washington Commanders

Senior Business Analyst. The analytics function for an NFL franchise: the department's only analyst, reporting to the VP of Strategy and Analytics, with work that reaches the club president.

Solar Reviews

Software Engineer. The engineering seat at a consumer solar marketplace: internal tools, the commission engine, and the company's Looker reporting system.

Miami Dolphins

Business Analyst. Ticket sales analytics for an NFL club, from daily executive reporting to the BI platform itself.

Saint Rose Men's Basketball

Director of Analytics, Graduate Assistant. Basketball operations from the inside, reporting directly to the head coach, with a 2023–24 return that ran alongside the Commanders job.

The full breakout: roles, education, and tools →