A full conference season, stats and video unified
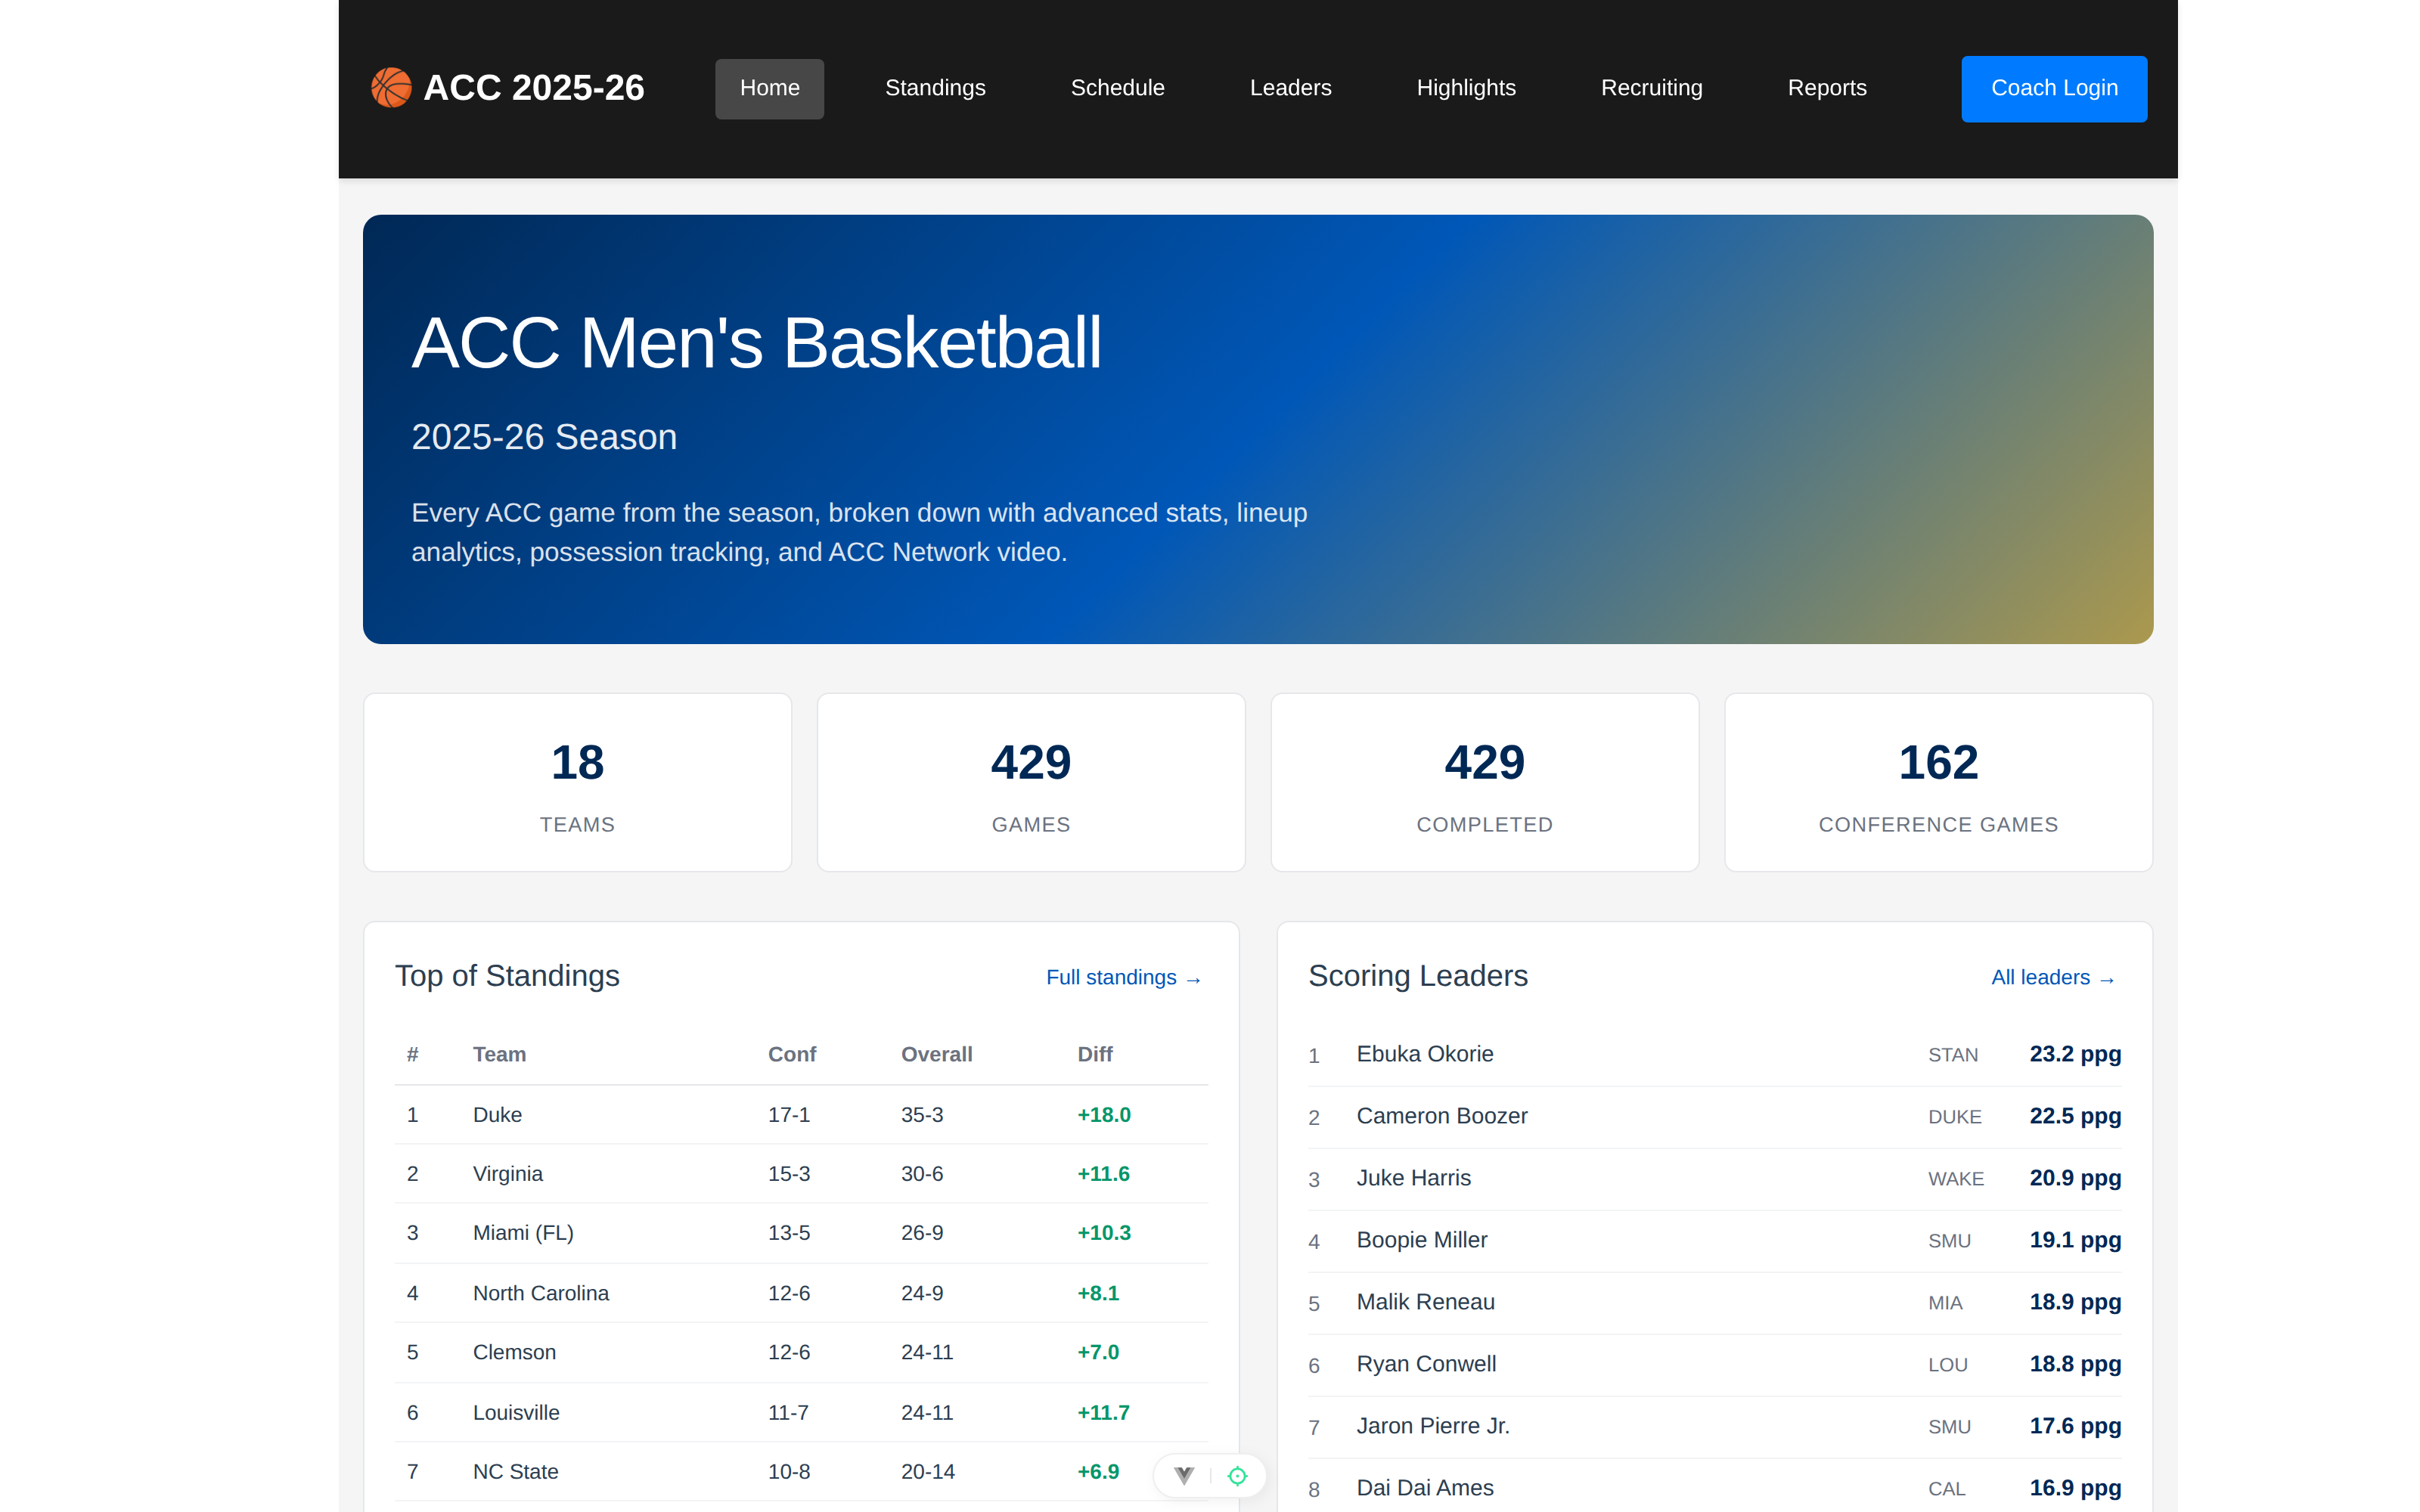
Every 2025-26 ACC men's basketball game in one system: play-by-play scraped and validated, lineup and possession analytics, shot charts, win probability, and full-game broadcast video keyed to the game clock.
- Games
- 429
- Teams
- 18
- Games with video
- 300
The coaching platform answers a question a staff has during a game. This project answers a different one: what becomes possible when a full conference season of play-by-play, lineup data, and broadcast film lives in one system instead of three. One conference, one season, every game.
It is a fork of the real-time coaching platform pointed at an archive instead of a live feed: the 2025-26 Atlantic Coast Conference men’s season, all 429 games across 18 teams.
A season as a dataset
The ingestion side scrapes the conference’s public schedule and box scores, then pushes every game through the same pipeline the live platform uses: play-by-play normalized to one event stream, possession boundaries marked, five-man lineups tracked with automatic recovery of messy substitution data, and aggregated stats validated against the official box score. Scrape logs make the whole thing idempotent, so re-running a season cannot double-import a game.
Having the season in one schema is what makes the conference-level views cheap: standings with scoring margin, leader boards, and team pages are just queries.
Game pages that go past the box score
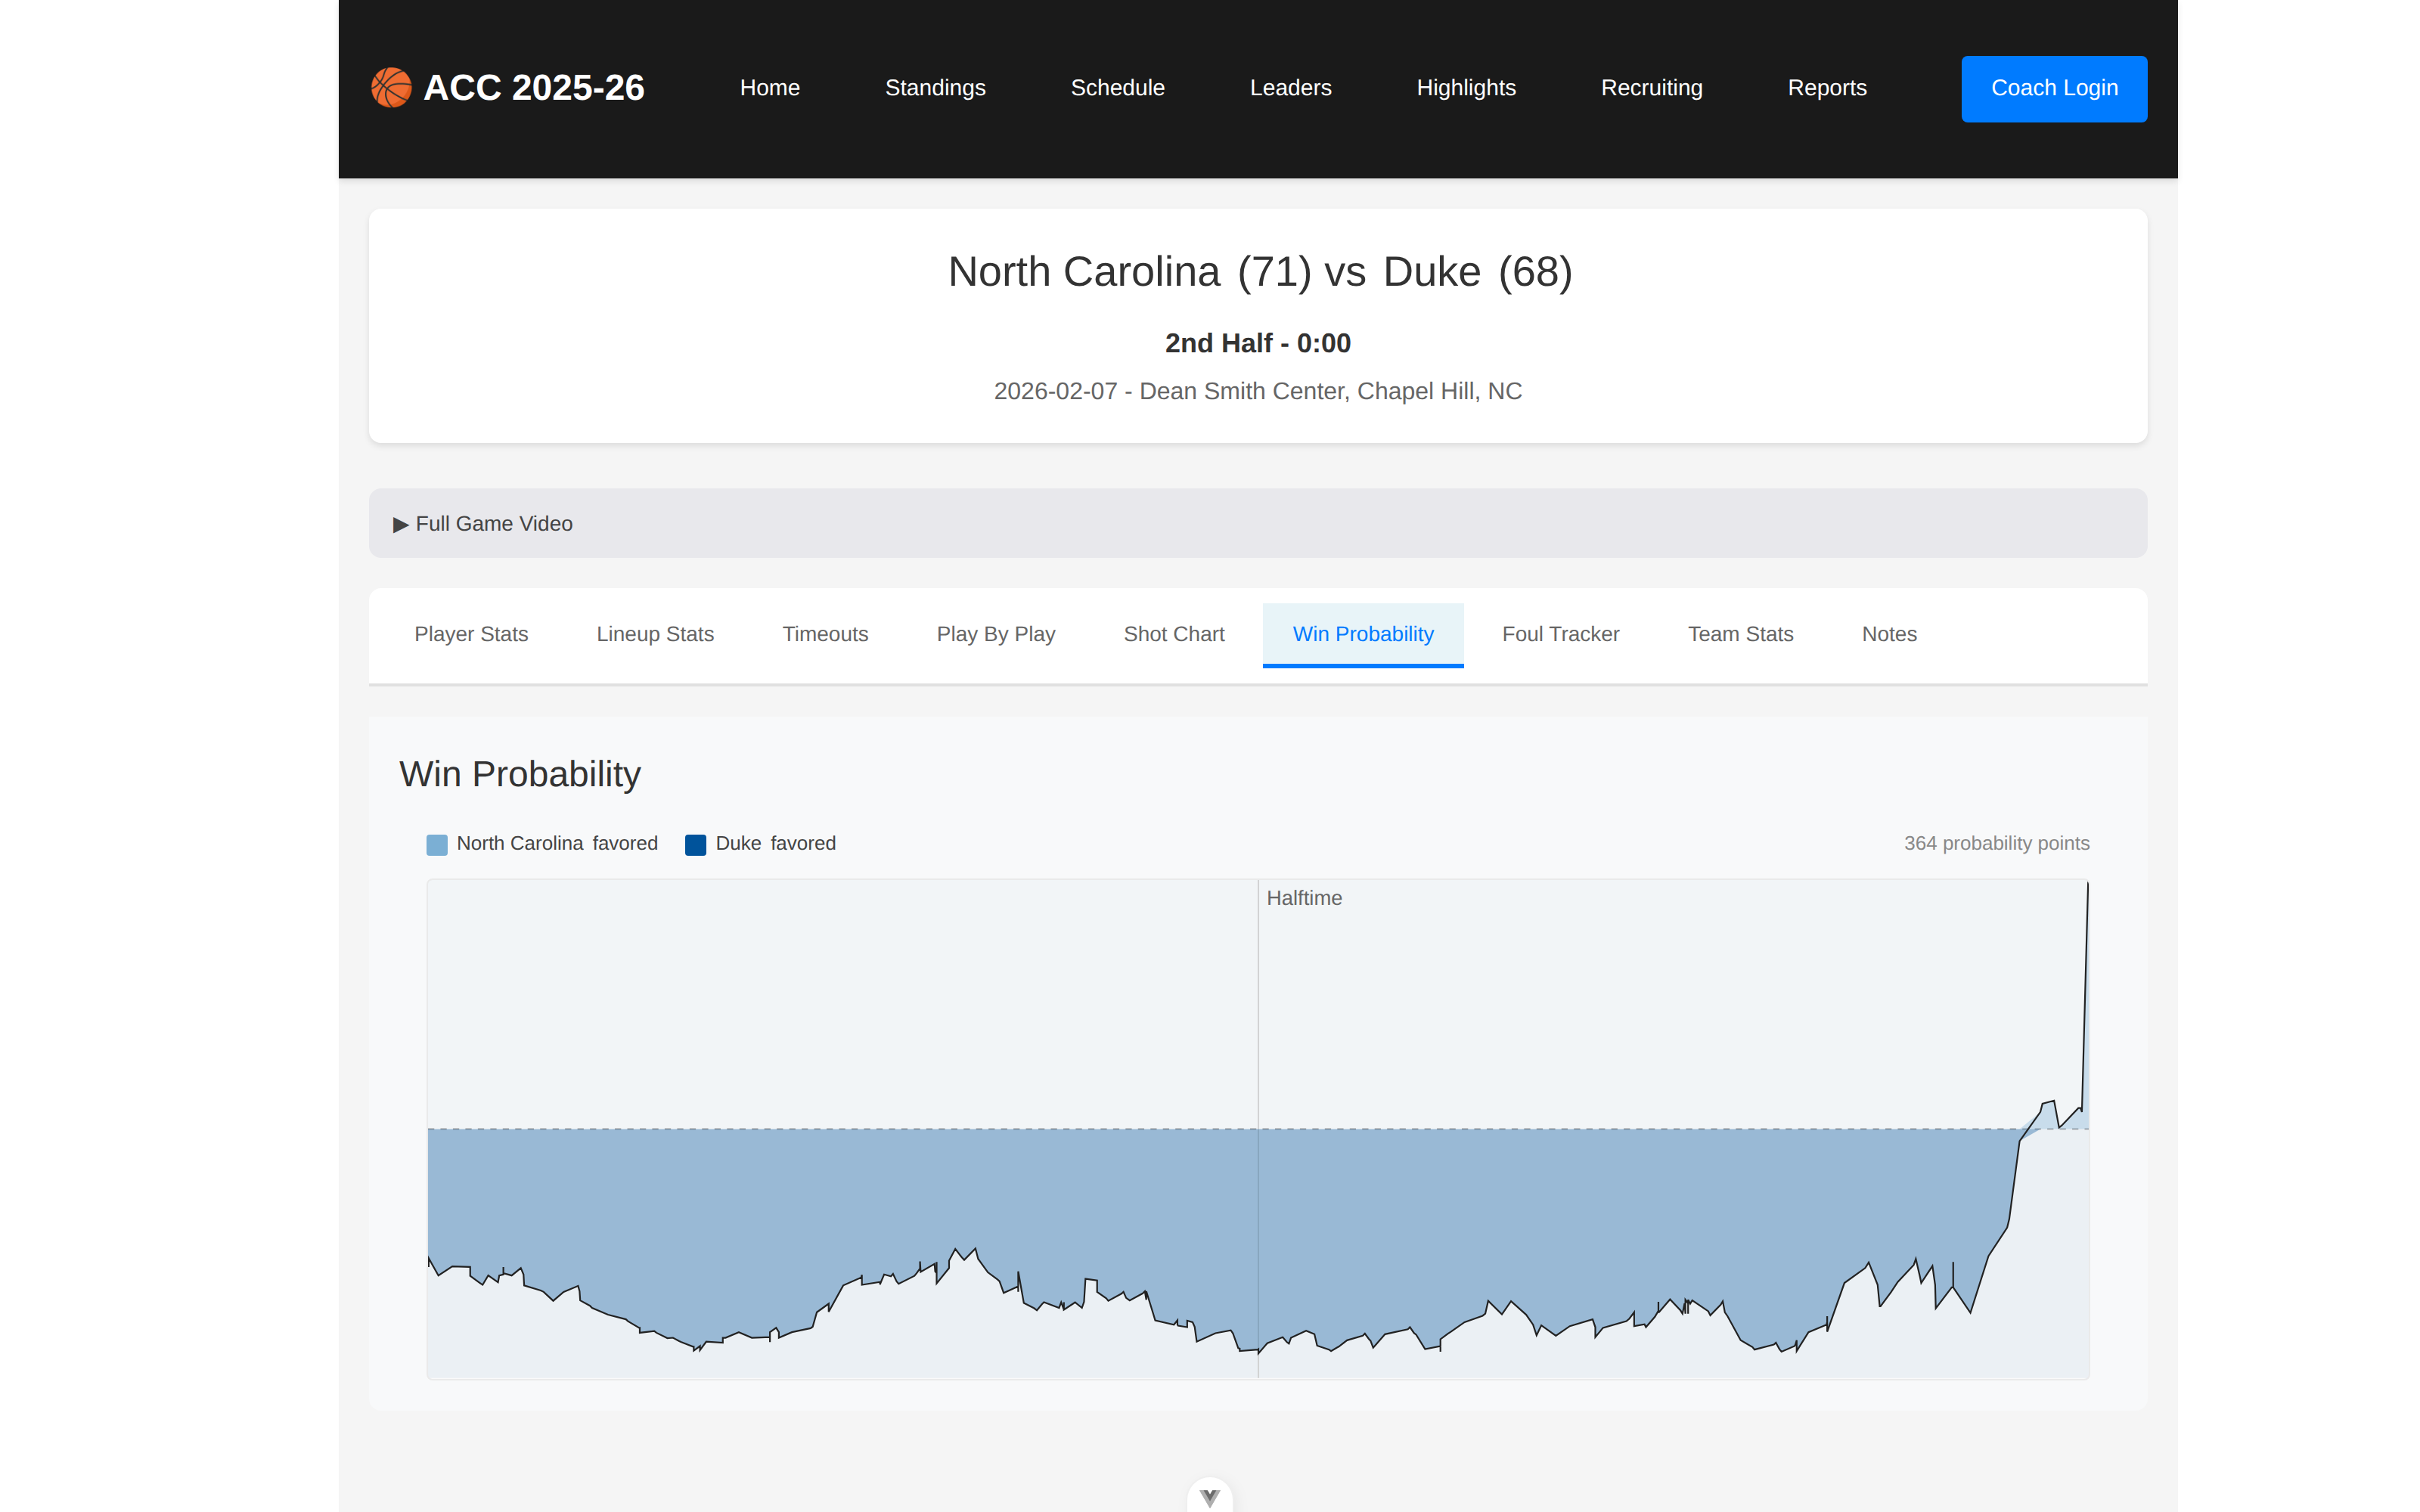
Each game carries the box score, lineup combinations with plus/minus, timeout and foul tracking, a filterable shot chart, and a win probability curve computed from the play-by-play. The screenshots on this page are from North Carolina 71, Duke 68, played February 7, 2026: 115 shots on the chart, 364 probability points on the curve.
The video layer
300 of the 429 games are joined to full-game broadcast recordings stored on my NAS, with the game clock mapped to video time. That is the piece that changes how the analytics get used: a lineup stint or a play-by-play row is not just a number, it is a timestamped pointer into film of the actual possessions.
It is also why this project stays on my hardware. The recordings are broadcast footage, roughly a terabyte of it, and it is not mine to republish. So there is no public demo of this one; it gets shown live, by screen share, which is how a film-plus-analytics tool gets used in a basketball office anyway.