Building the D2 basketball dataset that didn't exist
Nine seasons of college basketball in one warehouse: 72,593 games, 31 million plays, every Division II program's roster, staff, and player profiles. Built to answer a transfer portal question that no public dataset could.
- Games
- 72,593
- Plays
- 31M
- Seasons
- 2017–26
The question that started this: which Division II players project up a level, and where should a low-major Division I program be shopping? The transfer portal has made it a yearly problem for every staff. Answering it takes player production, competition quality, and career movement across divisions, all keyed to the same player.
No public dataset carries that. Division I is well covered. Division II is not. So the dataset had to come first, and it turned into the larger half of the project.
Identity before ingest
The first version drowned in names. One school appears across the web as UAlbany, SUNY Albany, Albany, and University at Albany, and matching on strings produced duplicates and misattributions that were only ever caught by hand.
Two things fixed it. Schedule pages link every opponent back to that school’s own athletics site, and roughly 98% of D2 uses the same web platform, so the host name is a consistent identity key where the school name never was. Then the NCAA’s own membership directory supplied authoritative organization ids, which also surfaced problems name matching could not: 15 women’s-only colleges that field no men’s team, 81 missing men’s programs, and closed schools absent from every current standings page.
The second platform looked like it would need separate work, since its schedule pages do not expose opponent URLs. I had started building a logo image matcher when the actual answer turned up: the id in its logo URLs is the NCAA code number already stored in the database. The crosswalk I was building by image comparison was a one-line join. The image matching also proved unreliable at its most confident setting, which settled the rule for the rest of the project. Key on the id, never on the string.
What is in it
The warehouse now holds nine seasons, 2017-18 through 2025-26:
- 72,593 games with 18.9M Division II plays and 11.9M Division I plays
- 117,996 player-seasons, plus 36,740 player photos and 37,974 bios
- 8,736 coaching staff records for the coach tracker and coaching trees
- 1,521 schools, every one carrying its NCAA id, including closed and relocated programs
Every D2 game was then cross-checked against NCAA records, and the gaps it flagged traced to two parser bugs rather than to missing data. Verified complete.
Getting the data at all
A player who transfers has to stay the same player in the data. Nothing on the public web keys that: schedule pages, box scores, and ESPN all identify players by name and team, which breaks the moment someone changes schools. The one source that carries a career-stable player id, across teams, seasons, and divisions, is the NCAA’s own stats site. Without it there is no career graph and no transfer analysis, only disconnected season lines.
That site sits behind enterprise bot management that bans by IP reputation. It banned my home connection twice, once for a full day. Commercial VPN ranges are blocked outright. The working answer was a residential proxy pool with rotating sessions, run so the home connection never touched the site again.
Then the cost problem. Solving the challenge takes a real browser, and a real browser pulls 0.77 MB per page. Blocking every script once the session is established drops that to 7 KB, turning a 38 GB crawl into under 1 GB. Shot charts were worse, since the coordinates are drawn by JavaScript. Fetching the cheap document and rendering it offline against one cached copy of the site’s own script cut roughly 14 GB to about 0.5 GB.
That scrape landed 65,000 player pages carrying the career id, plus rosters and play-by-play for every D2 program back to 2017-18. Total spend across all of it stayed under $25.
Validation as a feature
Ingestion validates aggregated play-by-play against official box scores and stores only the discrepancies. During the first wave that caught 18 distinct bugs, each of which would have been silent corruption at scale: inverted away scores, dropped zero values, overtime detection, column mapping.
The worst one was subtler. A home-and-home series produces two real games with mirrored scores, and three places in the code identified a game by teams and score without regard to which side was home. One of them had already deleted a legitimate game as a duplicate.
Raw pages are archived, so fixing a parser is a re-parse against local files rather than a re-crawl. Every bug fix in the project cost zero network traffic.
What it already powers
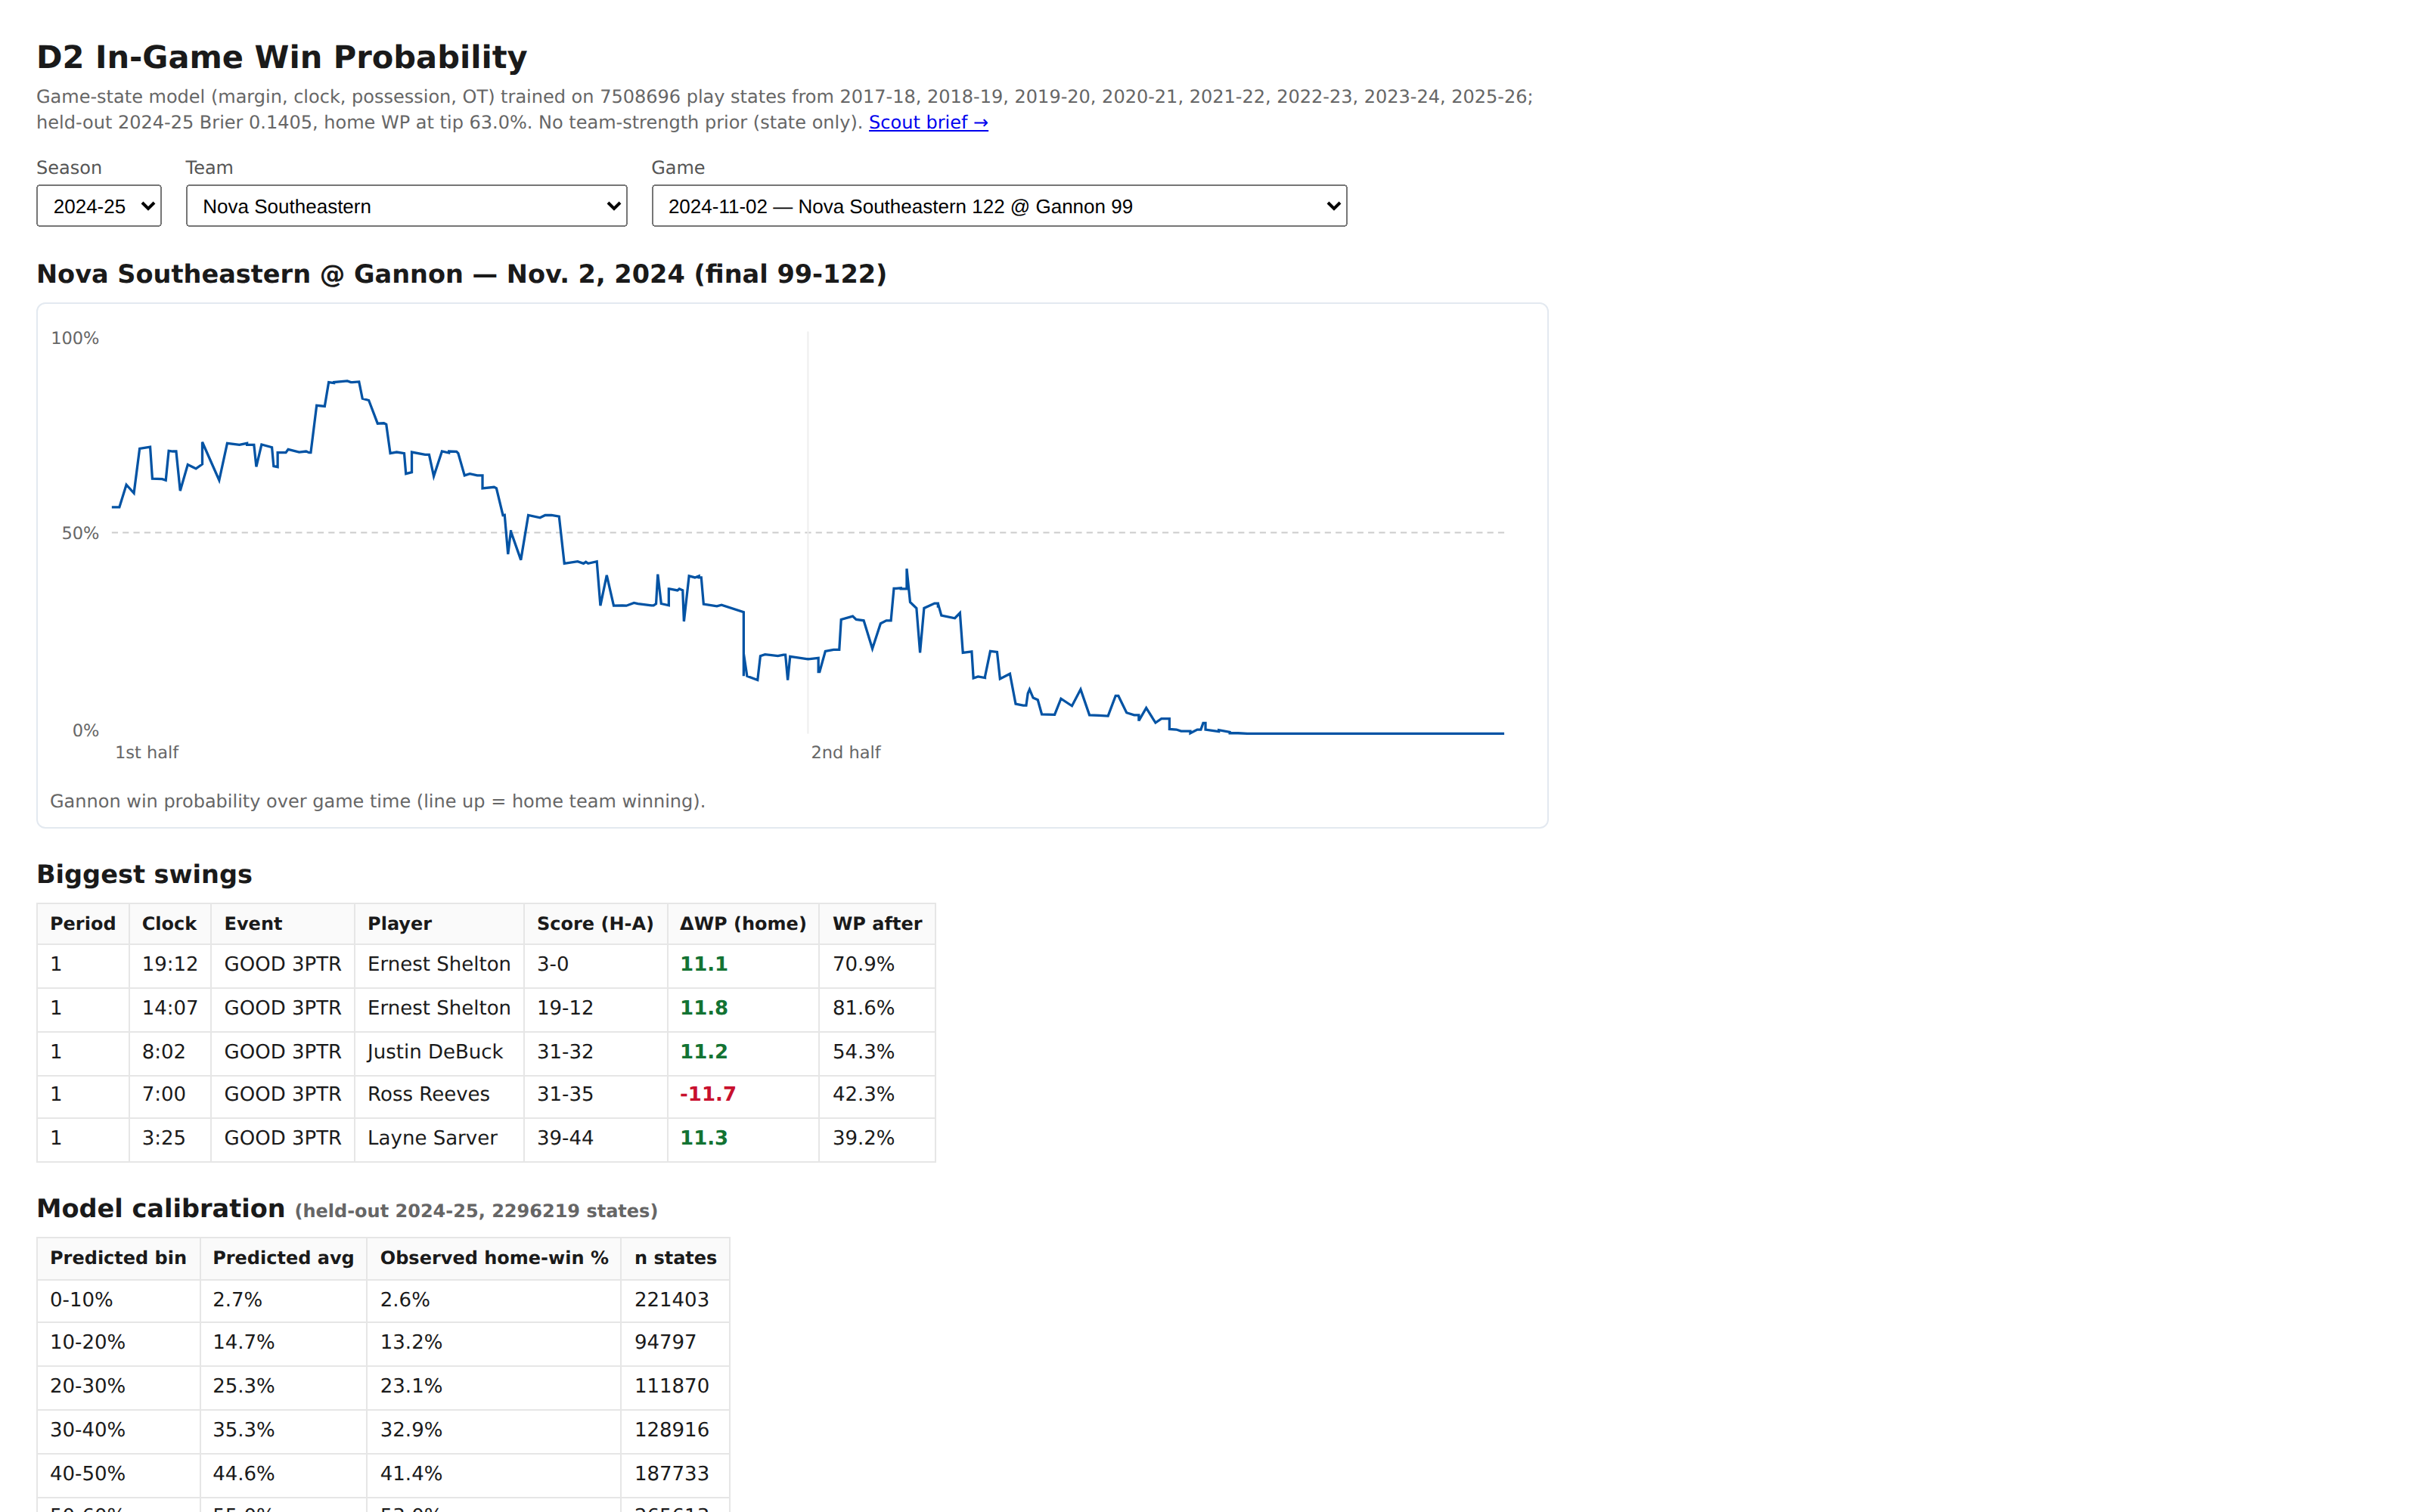
The warehouse feeds a research suite: a league-benchmarked scout brief, an in-game win probability model, a transfer fit-finder, a coach tracker with career trajectories, a recruiting atlas, and a rotation map built from lineup stints.
Where it stands
Player identity is done for both divisions, 2020-21 forward. Division I was supposed to be the easy half. ESPN publishes an open API, so I ingested six seasons from it, 32,244 games and 11.9 million plays. What it does not publish is substitution events. Without them there is no way to know who is on the floor, which means no lineups, no on/off splits, and no way to judge production in context. For a fit model that is the whole game.
Getting substitutions means going back to the NCAA source for Division I too, at several times the volume of the D2 crawl, against a site that had started blocking the proxy pool by the end of the last run. That is a real cost and a real fight, not an afternoon. So the fit model is parked at a known blocker rather than a vague one. The warehouse and the tools on top of it work today; this piece waits until the D1 lineup data is worth going after.