NFL warehouse and front-office tools
A Postgres warehouse over five seasons of public NFL data, and a Django application that turns it into decision tools: an empirical draft-pick value chart, a player availability model, and a fourth-down decision grader.
- Seasons
- 2021–25
- Trades valued
- 1,662
- Holdout Brier
- 0.0739
Public NFL data is abundant and badly organized. nflverse publishes excellent raw feeds, but every question worth asking spans four or five of them, and nobody ships the joins. This project is the warehouse that does, plus the tools that fall out of having it.
The warehouse is Postgres, loaded from nflverse for 2021 through 2025: full play-by-play with EPA and CPOE, participation data with personnel groupings and coverage, FTN charting, Next Gen Stats, Pro Football Reference advanced splits, rosters, contracts, and draft history reaching back to 1980. Ingestion is a single command per dataset and season, so refreshing after a week of games is one line.
On top of it sits a Django application. Three of its tools are worth walking through.
Rebuilding the draft-pick value chart
The Jimmy Johnson chart has priced NFL draft trades since the early 1990s. It was never fit to data. It was a negotiating tool that became convention, and it is still the reference point in most trade coverage.
I fit the replacement directly: mean career approximate value by draft slot, across every draft from 1980 to 2015, normalized so the first pick equals 100. The result disagrees with the convention sharply. My curve prices the first overall pick at roughly 1.9 times the 32nd. The Johnson chart prices it at 5.1 times. Early picks are worth far less, relative to late first-rounders, than the market has assumed for thirty years.
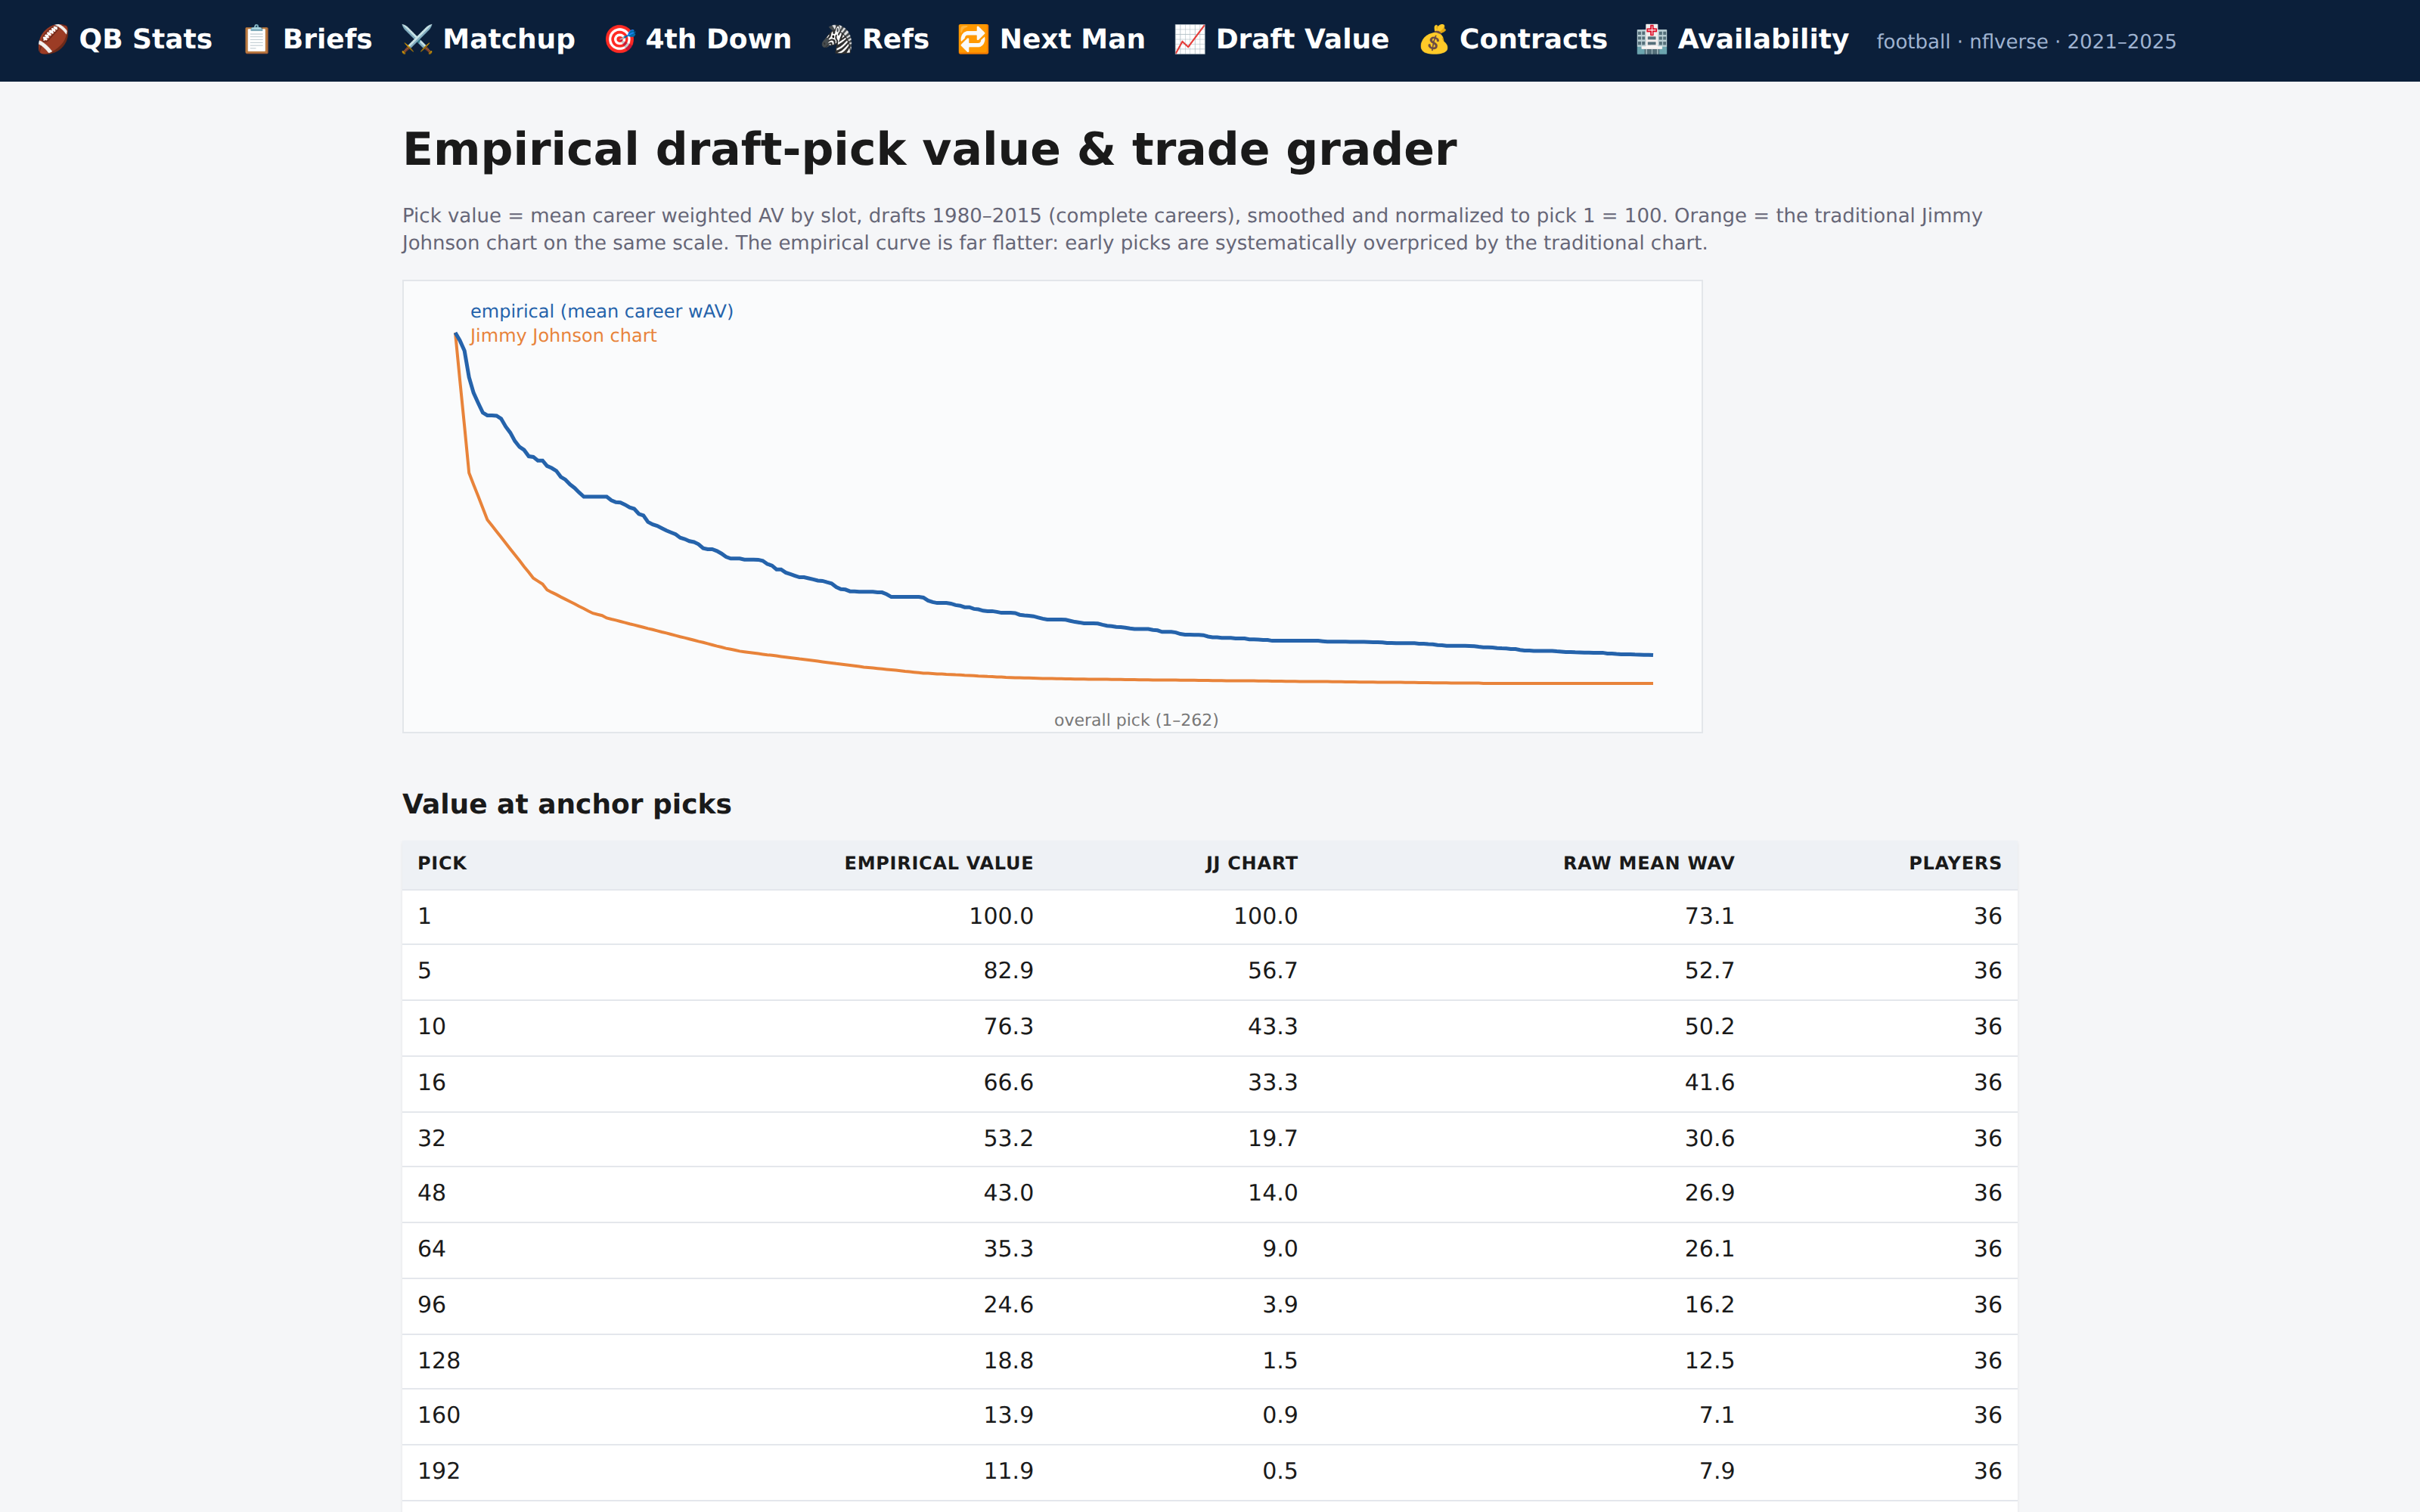
With a value curve in hand, grading trades is mechanical. The application values both sides of all 1,662 two-team draft trades from 2002 through 2026, reports the expected edge as a nearest-pick equivalent, and sets it against the career value each side actually received. The famous quarterback trade-ups (Goff, Griffin, Darnold, Wentz) sort to the top of the fleece list, which is a good sign the model is measuring something real.
The decision, and what it costs. Mean career approximate value is a defensible proxy for pick value, and it is the only one available consistently back to 1980. It is also lossy in ways worth naming. Approximate value compresses positional differences, so a franchise quarterback and a very good guard land closer together than any front office would accept. Cutting the training window at 2015 keeps careers mostly complete but means the curve cannot see how the rookie wage scale changed pick economics after 2011. A median or a replacement-level baseline would blunt the effect of a handful of superstars on the early slots. I chose the mean because the tail is the point: teams trade up precisely to buy the chance at an outlier.
A player availability model
Injury reports are public and formulaic. Every listed player carries a designation (Questionable, Doubtful, Out) and a practice status for each day of the week. Everyone reads them. Almost nobody has calibrated them.
The model estimates the probability a listed player actually takes the field, from designation crossed with final practice status. Questionable players practicing in full play 76% of the time, limited 69%, and not at all 46%. Doubtful behaves almost identically to Out. Position and injury type get their own drilldowns, shrunk toward the league rate with k=25 so a small sample of hamstrings in one position group cannot produce a wild number.
Trained on 2021 through 2024, held out on 2025, it scores a Brier of 0.0739 against 0.0787 for a baseline that only knows the designation. That is a modest improvement, and I would rather report it honestly than dress it up. The practice-status signal is real but not enormous, which is itself the useful finding.
A fourth-down decision grader
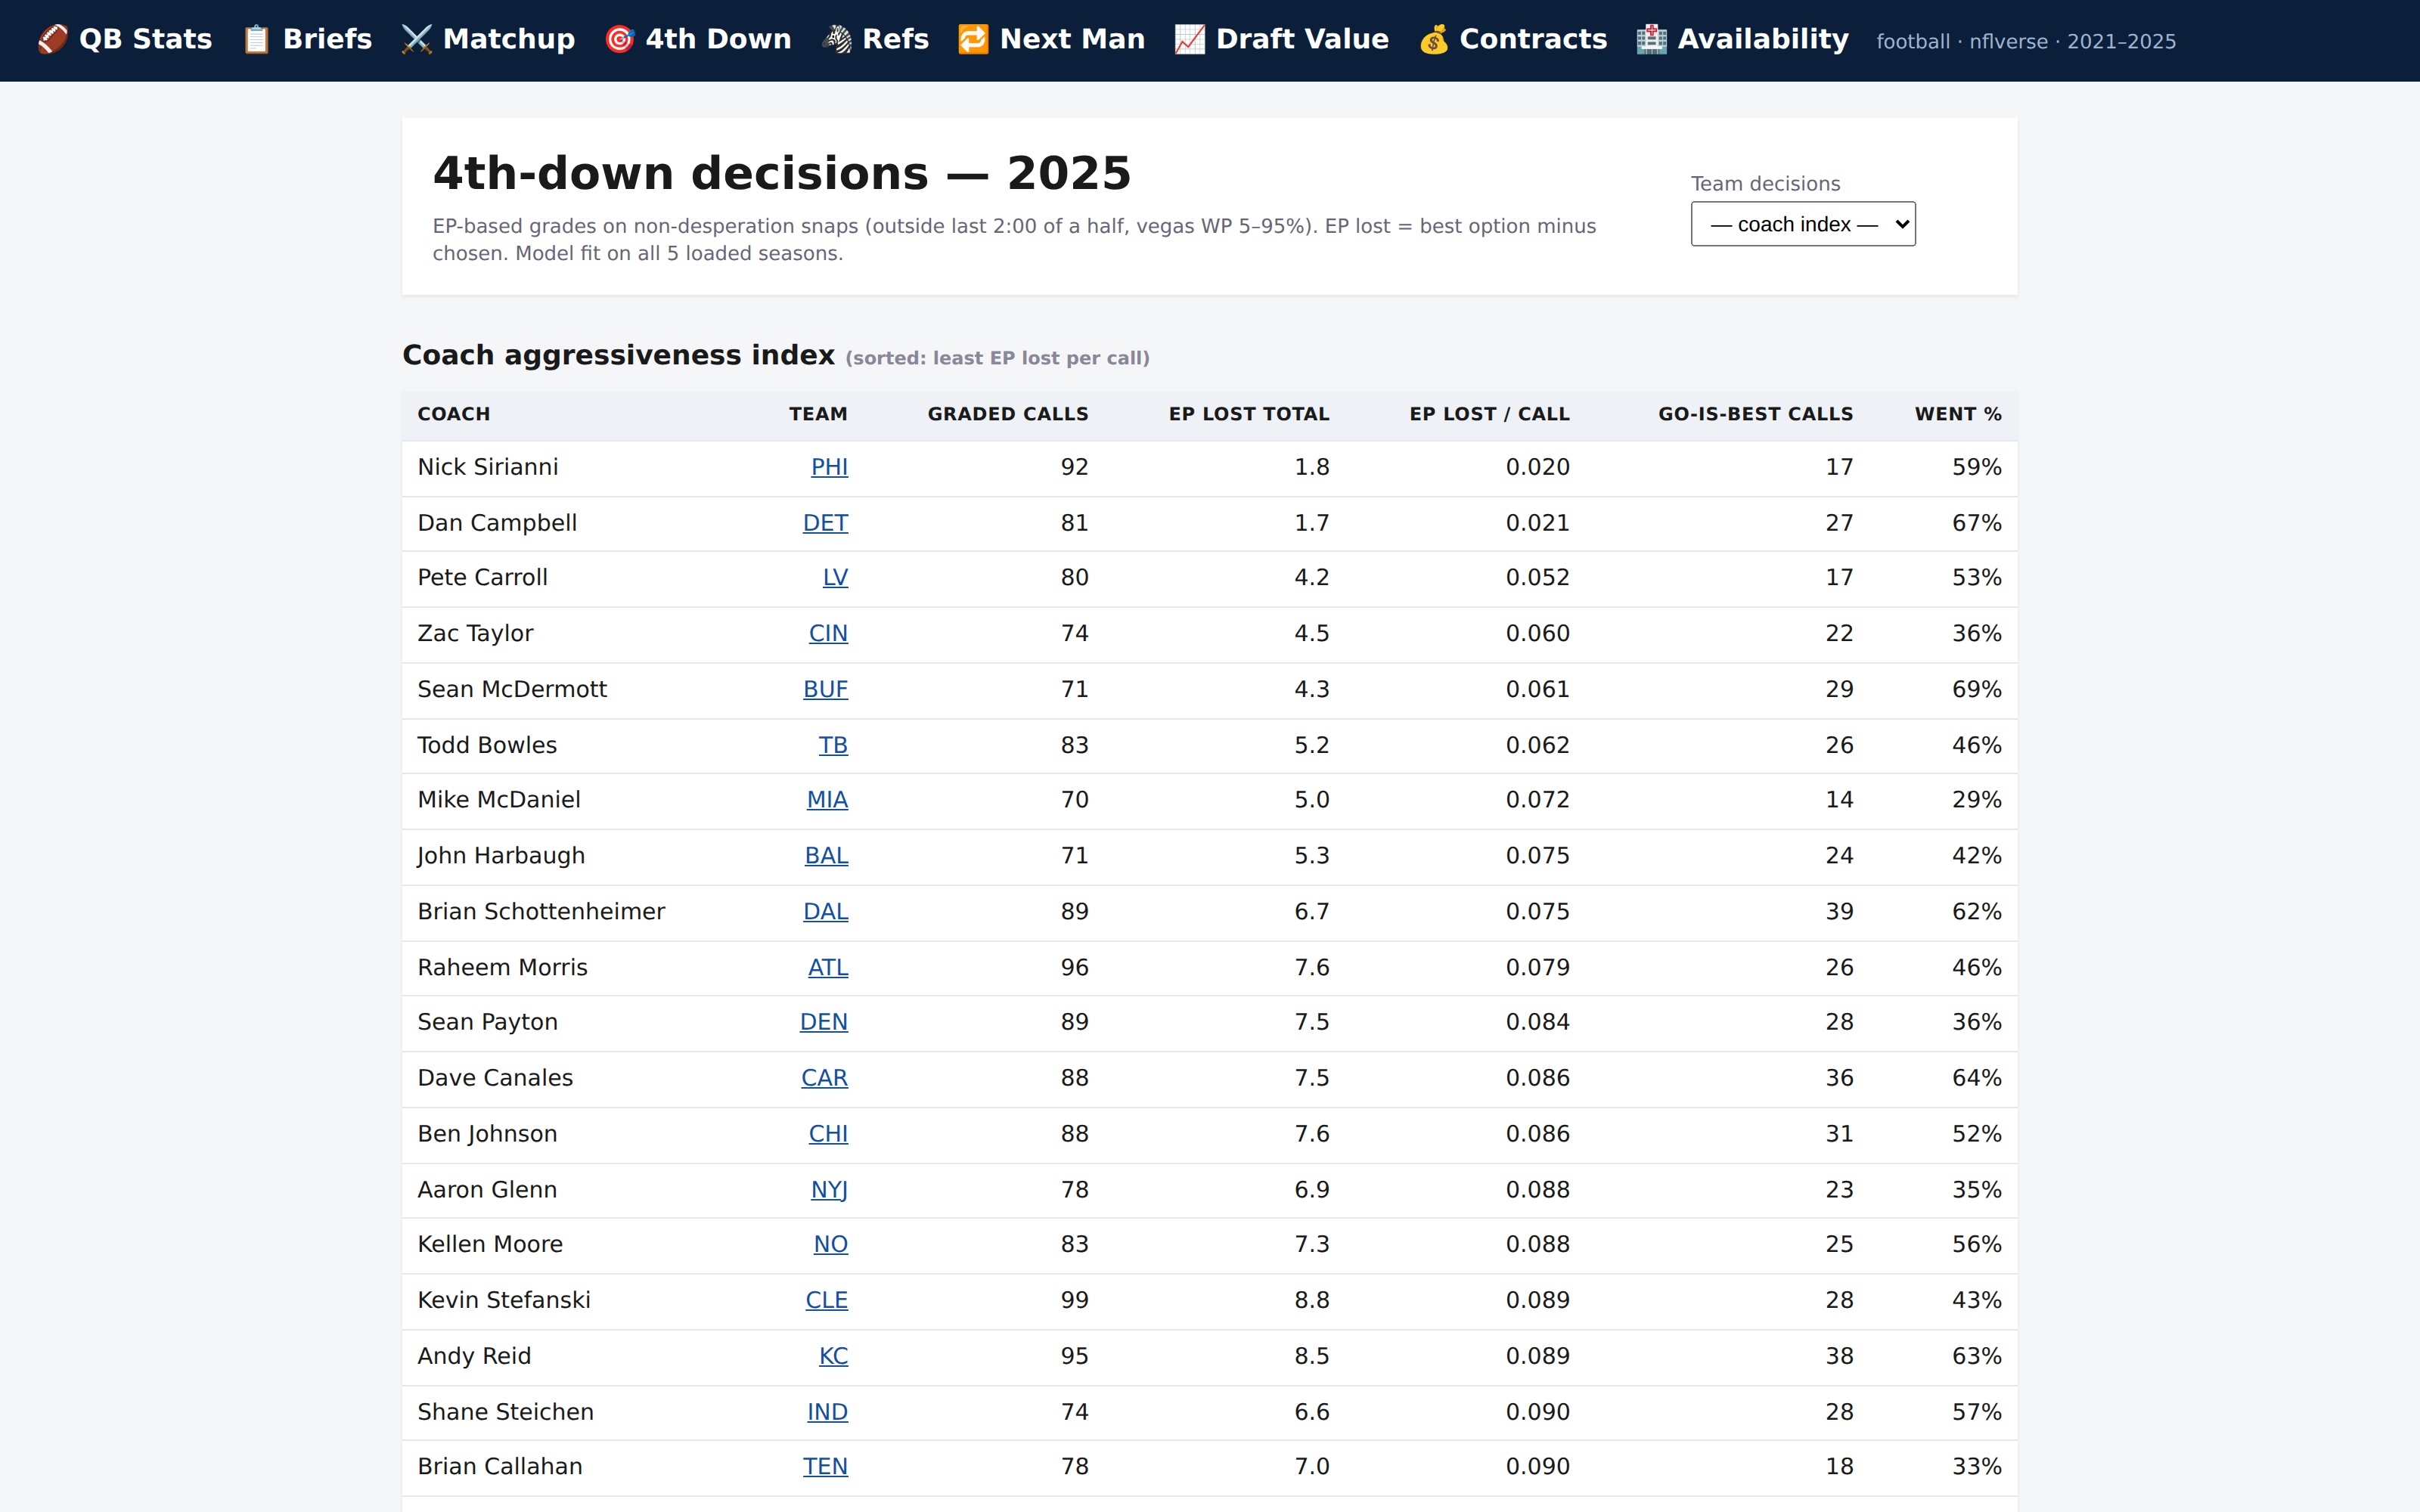
The fourth-down grader fits an empirical expected-points model across all five seasons and compares each real decision (go, punt, kick) against the highest expected-value option available in that situation. Aggregating the residual by head coach produces an aggressiveness index.
This one exists because it is the most legible model in the project. Anyone can check it against a game they watched, which makes it the fastest way to find out whether the expected-points surface is wrong.
Notes on the demo
The public demo does not carry the full warehouse. The play-by-play and participation tables are about 70% of it, and almost none of what these three tools display needs them at query time. The fourth-down decisions are precomputed into a small table, the draft tools read draft and player history only, and the availability model ships as a trained artifact next to the injury and snap-count tables it scores. The demo is a few hundred megabytes rather than a few gigabytes, and it returns the same numbers.