A season of NWSL data, stood up in one morning
A LinkedIn post shared free StatsBomb event data for the 2023 NWSL season. By breakfast a Postgres warehouse, an API, and a dashboard were running; by the end of the day the database held thirteen women's competition-seasons.
- Hands-on time
- ~2 hrs
- Matches
- 137
- Shots
- 3,530
One morning I saw a LinkedIn post sharing free Hudl StatsBomb event data for the 2023 NWSL season. Using Claude Code, I had a Postgres database, an API, and a dashboard running before my wife, who is a serious NWSL fan, came down for breakfast.
What got built
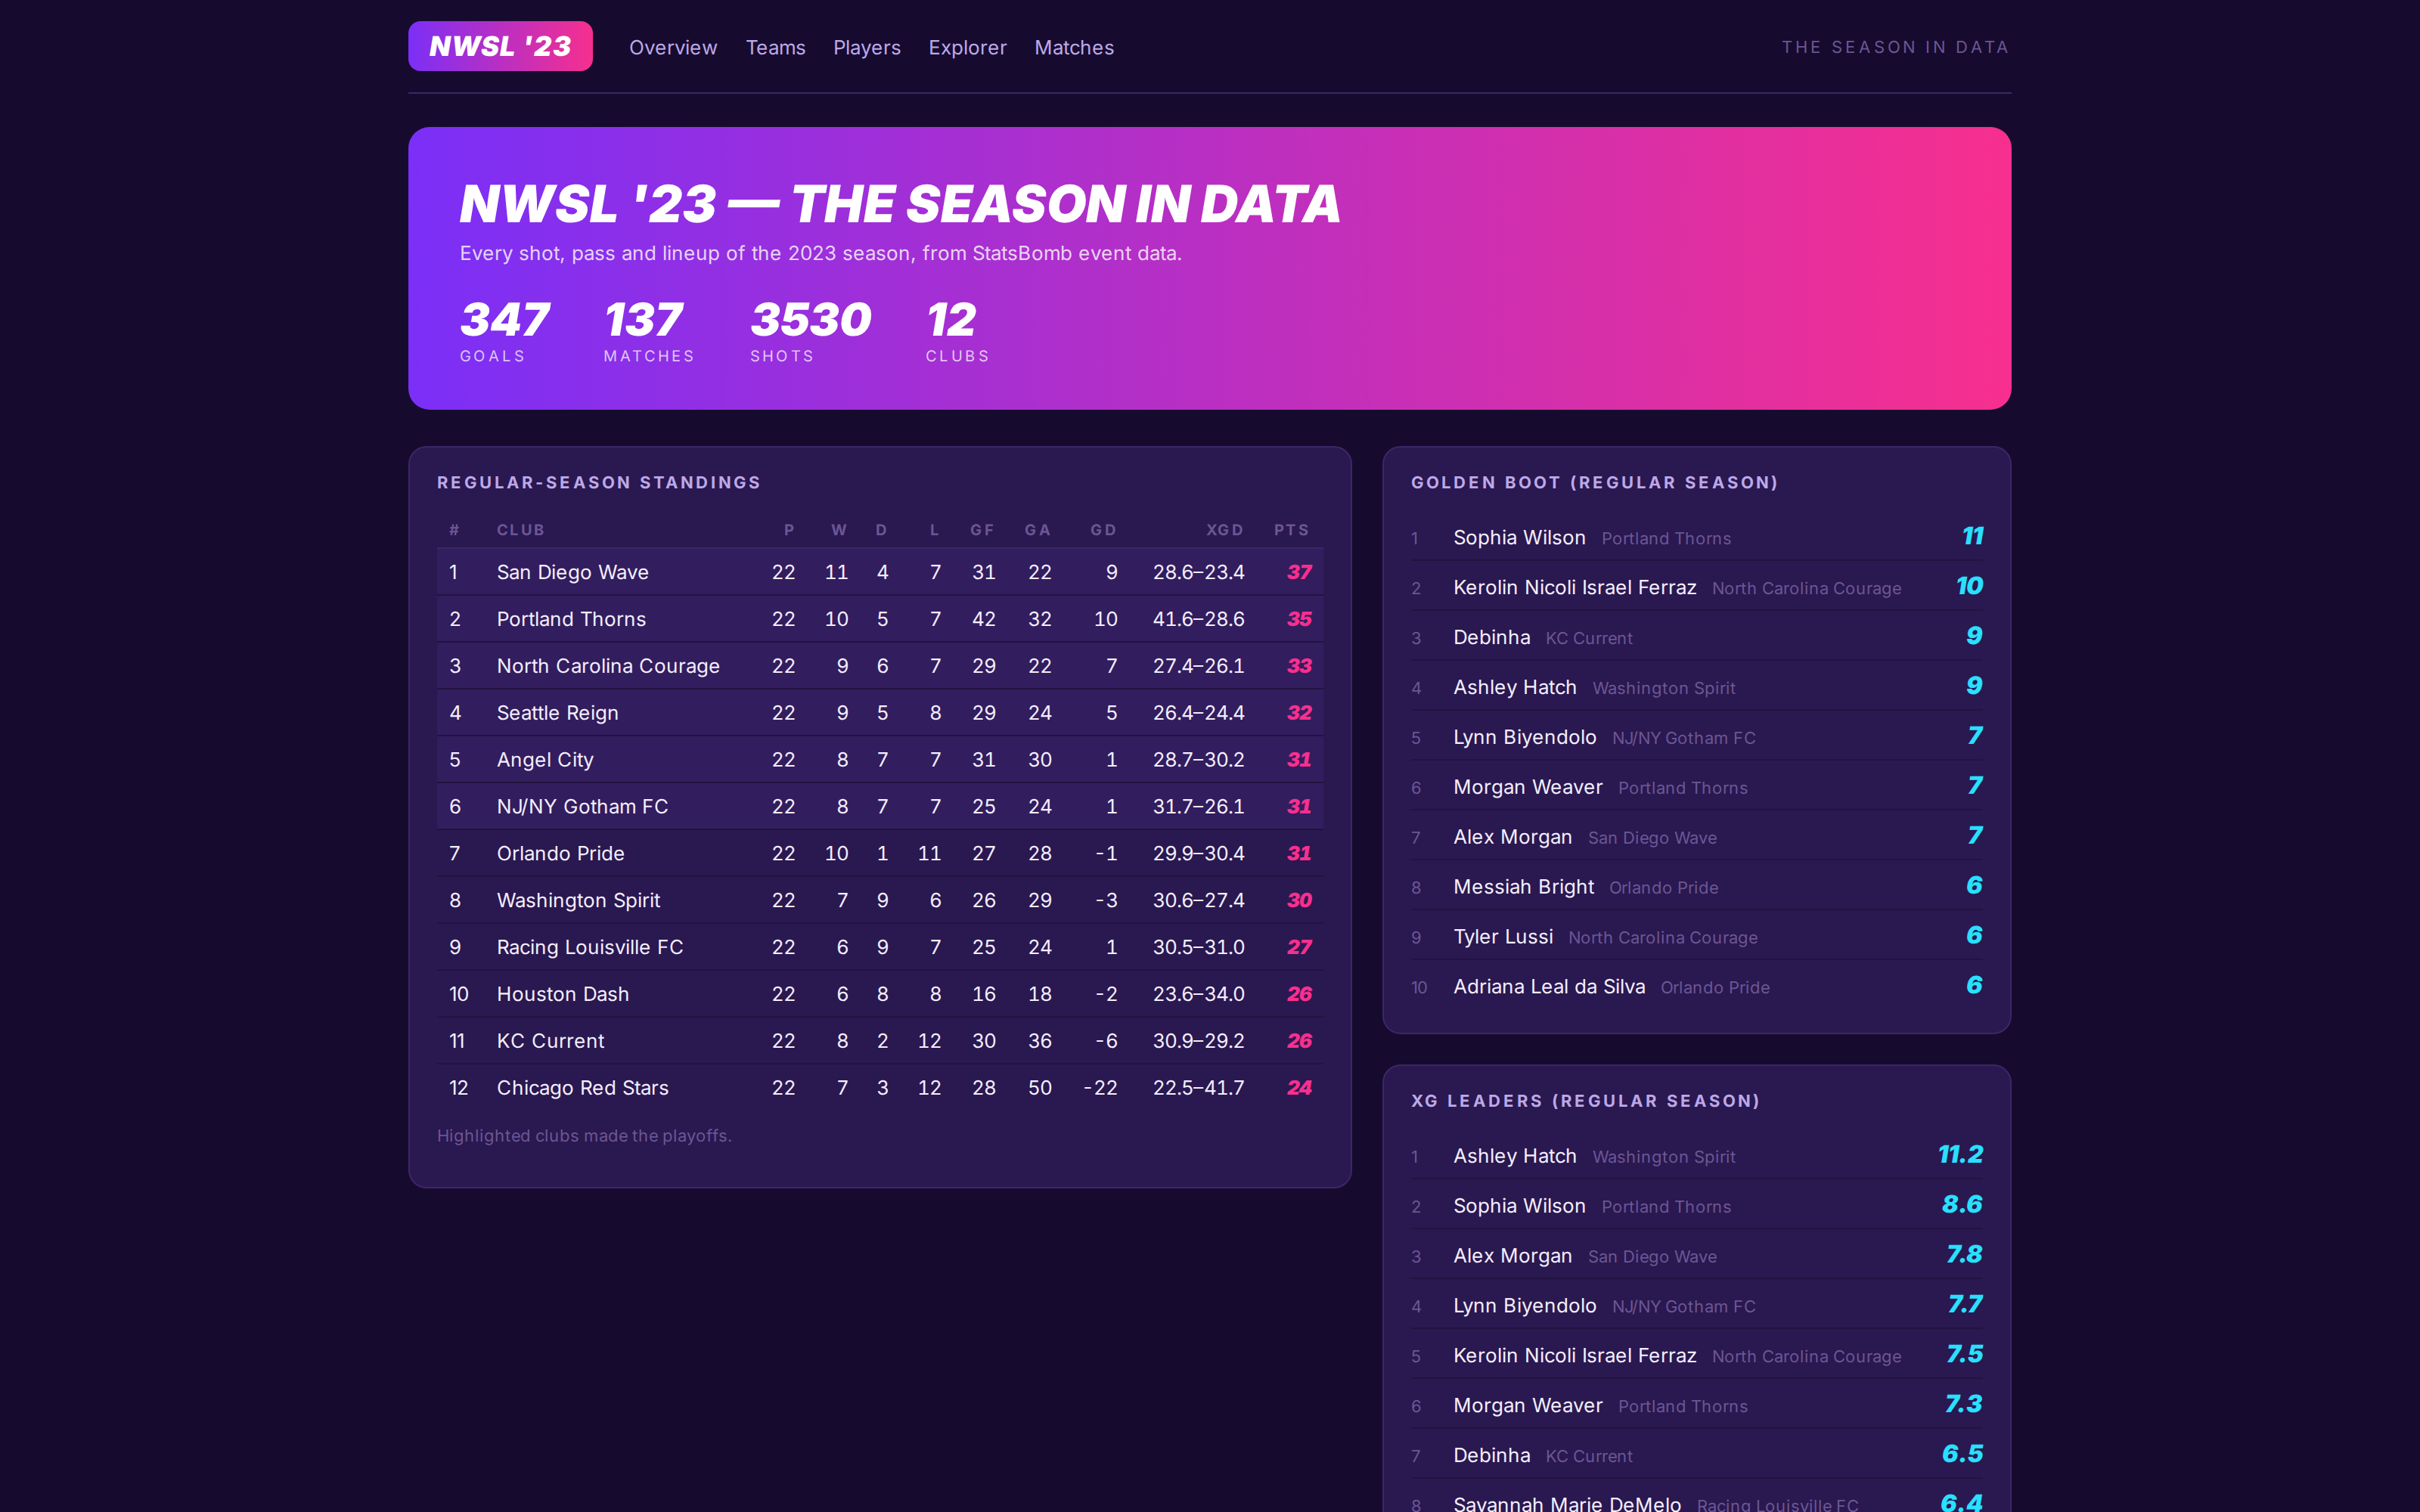
The event feed loads into Postgres, season aggregates run as materialized views, and a Django app serves pages for the league, every club, every player, and a free-form explorer for anything the fixed pages do not answer.
Every player gets a page built around a percentile radar against positional peers, with a shot map, a pass map that filters down to chances created or progressive passes or balls into the box, and a heatmap of everywhere they touched the game.
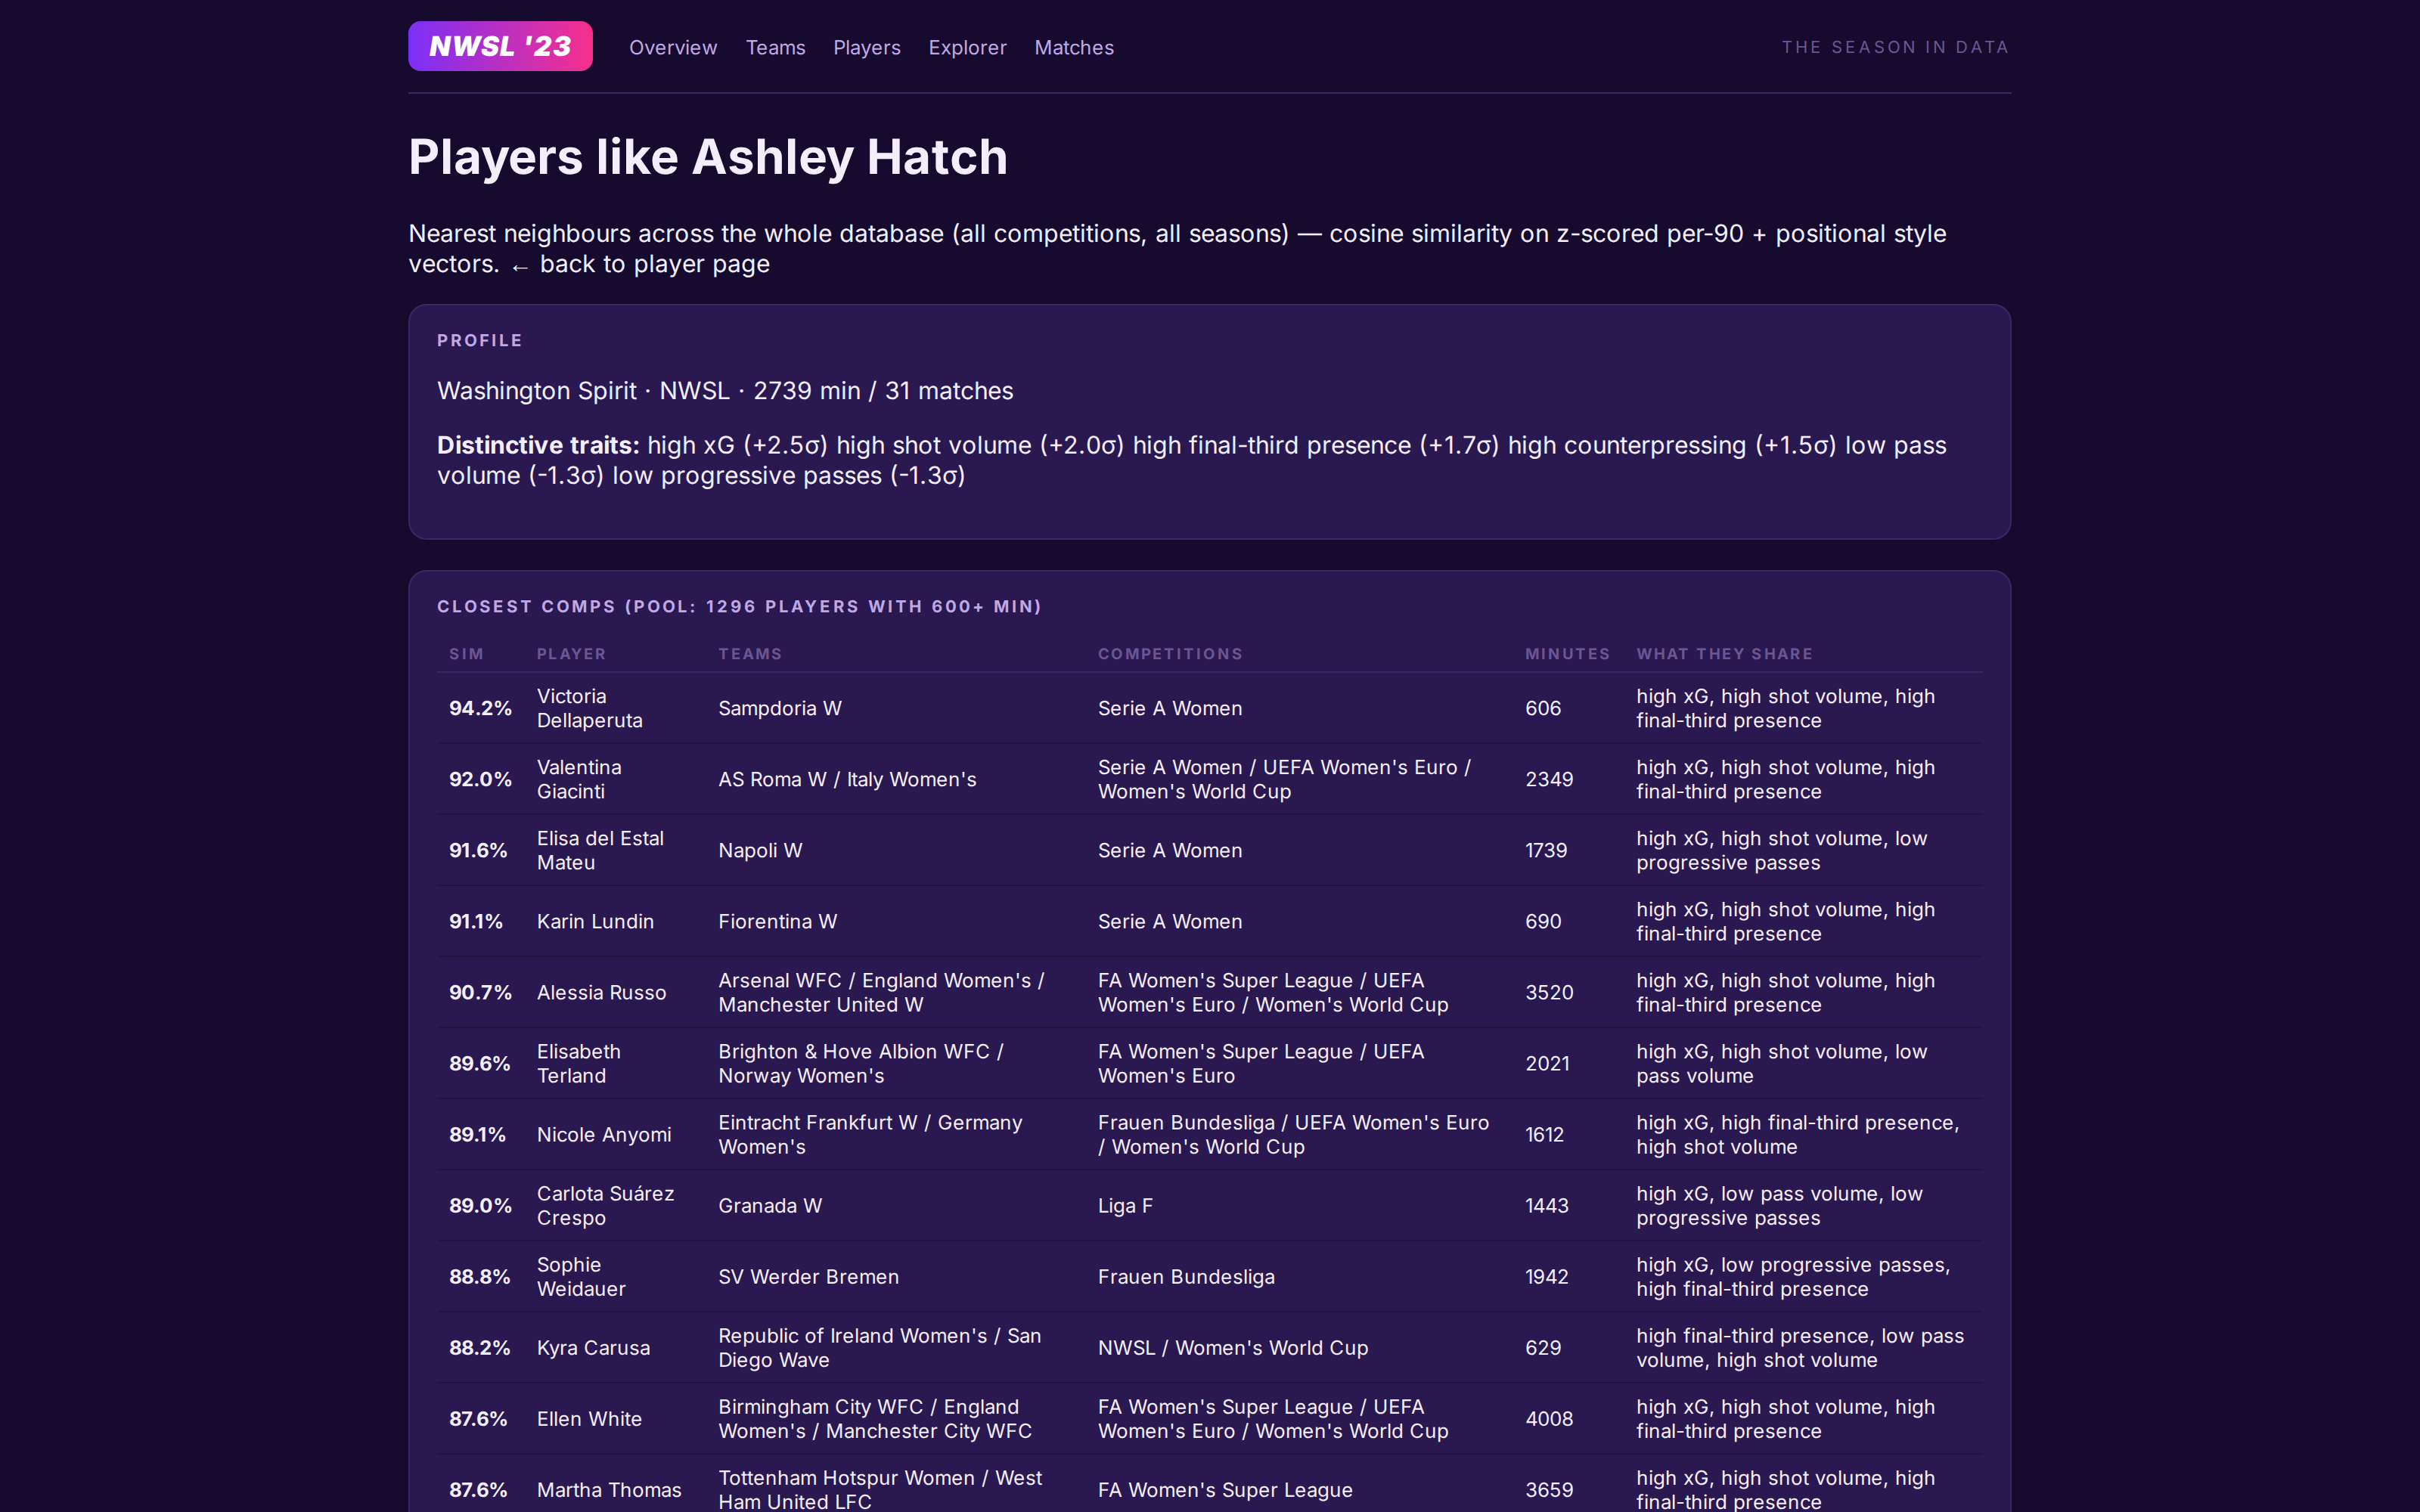
Later that day I asked for a player similarity engine on a whim, and it took about ten minutes. It scores everyone in the database on a 28-dimension vector of per-90 rates and style measures and finds nearest neighbors by cosine distance. Because it searches all thirteen competition-seasons rather than the NWSL alone, a Washington Spirit forward comes back matched against strikers in Serie A and the WSL, each comp listing the traits the two of them share.
What the data said
Ashley Hatch led the league in expected goals at 11.2 and scored 9, which is a finishing conversation. Her profile also grades high on counterpressing, which is not a conversation anyone was having about a center forward. That pattern repeated: attacking players carrying real defensive workload that never shows up in how they get discussed, and well-known players with obvious holes in their profile that nobody brings up.
None of this would impress the front office of a real club. It is a fan’s tool and it works as one. My wife has followed the league for years and still picked up a few things.
Why it matters
For most of my career a project like this meant days of standing up infrastructure, then more days making a dashboard presentable enough to show anyone. Software that used to cost thousands of dollars to build now costs pennies, and that is where the leverage actually is. When a working version takes five minutes, you can put three options in front of the person who asked and let them choose the one that answers their question, instead of defending the one you spent a week building.
What that leaves is the part that was always the job. Knowing the data well enough to tell when a number is wrong, and being the person who can say whether the output is trustworthy. This project is a weak example of that, since I do not follow the league closely enough to catch a subtle error, but that is the point. The tooling got fast. The judgment and understanding did not get any less necessary.